
")

Indicator Name: ClusterDelta_#CumDelta, ClusterDelta_#CumDelta_Chart
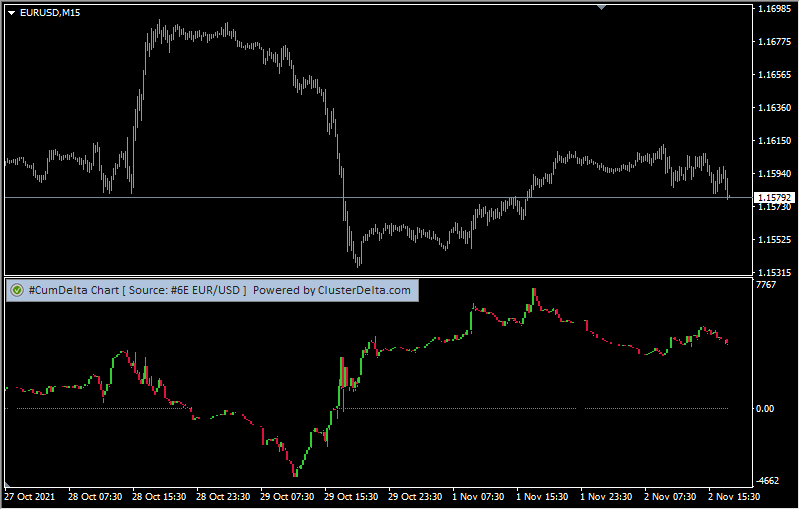
The cumulative delta indicator shows the dynamic of the delta changes over time, so this indicator shows the sum of deltas from the beginning of the selected period to the current moment in the cumulative mode.
You should know that Delta Indicator show the difference between ASK volume and BID volume. This indicator shows how delta changes over a period, so it shows the accumulation of the delta values.
The data appears as a cumulative delta curve or as an OHLC delta plot in a separate window. In the highly liquid markets the accumulative delta practically repeats the price chart, but sometimes divergences can occur, which are a sign of a change in the price trend
The #CumDelta indicator uses additional libraries that download data in the background and receive data online with instant drawing on the chart. In addition, in the settings it is possible to configure the length of the history in days, which allows you to make backtests on historical data. It is also possible to load history with one click (by the button "Load More History"), which is located in the place where the previous loaded period of data ended.

Description of indicator inputs:
- HELP_URL (default value "https://clusterdelta.com/cumdelta") - this is the URL where you can get the full description of the indicator.
- ChartInstrument - select a futures from the dropdown list as the source for data. Value AUTO causes automatic detection of the instrument by the MT ticker.
- MetaTrader_GMT - the GMT value of your Metatrader. In 95% of cases leave AUTO.
- Days_in_History (default value is "0") - this parameter defines the number of days to download history. For a "0" value , the server uses the optimized history length settings. Using too high values can cause to the terminal freezing on lower timeframes. It is recommended to use short periods and load more data from the chart using the button "Load More History"
- Number_Of_Bars (default value is "0") - the number of bars to the end of the chart for calculating the cumulated delta.
- ResetSessionData (default value "false") - this parameter determines whether the cumulative delta value should be reset to "0" in the time specified in the SessionHour and SessionMin parameters.
- SessionHour, SessionMin - values of the hour and minutes when to reset the cumulative delta if the ResetSessionData parameter is set to "true"
- Custom_Start_time, Custom_End_time (default value is "2021.01.01 00:00") - if Custom_Start_Time and Custom_End_Time differ from "2021.01.01 00:00", the server loads history for the period specified by these parameters
- ReverseChart (default value is "false") - for reverse currency pairs with names that differ from "USD/JPY", "USD/CAD", "USD/CHF", the value must be "true" to flip indicator data according to the direction of the price chart
- DO_NOT_SET_ReverseChart (for"...for USD/JPY, USD/CAD, USD/CHF --") - the comment in the inputs about the information describe above
- Show_Cumulative (the default value is true, this parameter is existonly in the ClusterDelta_ #CumDelta_Chart indicator ) - the parameter indicates whether to show the cumulative delta in the accumulation mode. If set to false, the cumulative delta is reset with each bar and, the indicator will show a chart of the usual delta, but with shadows of the delta change during the time within timeframe
- Current_CumDelta (default value Black) - the color of the cumulative delta text of the last (current) bar. Given that the absolute value is not useful, it is recommended to set this parameter to the background color.
- Font_Size (default values is "8") - font size of current values of Ask and Bid histograms
- GUI (default values is "true") - flag indicating the need to draw a graphical user interface (control panel)
- GUI_Hint - using the keyboard : press "Z" to show/hide a graphical control panel
Alternative modification CumDelta_Chart considers delta movement within timeframe period, therefore delta peaks are displayed as OHLC candle

