")
Indicator name: ClusterDelta_#DPOC
POC (Point Of Control) is the price level for the period of time where the largest amount of volumes was traded. So the price of the biggest volume in a Market Profile is POC.
DPOC (Dynamic Point of Control) is a line on a chart of how the POC moves over a period of time
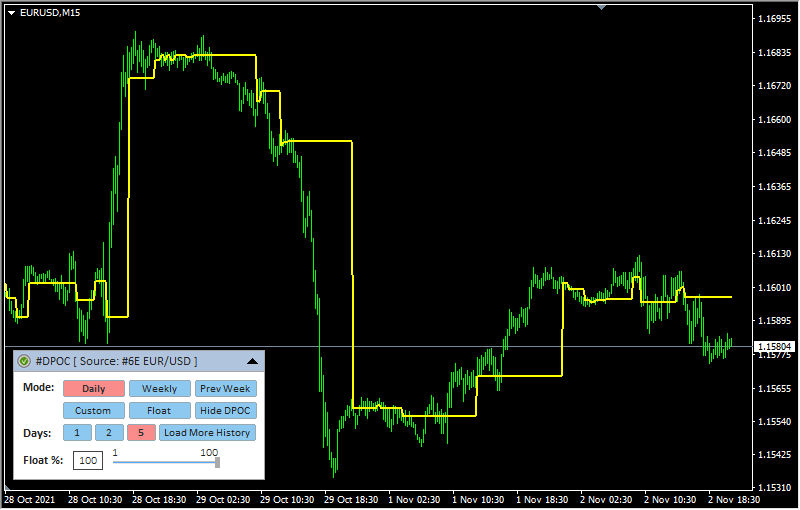
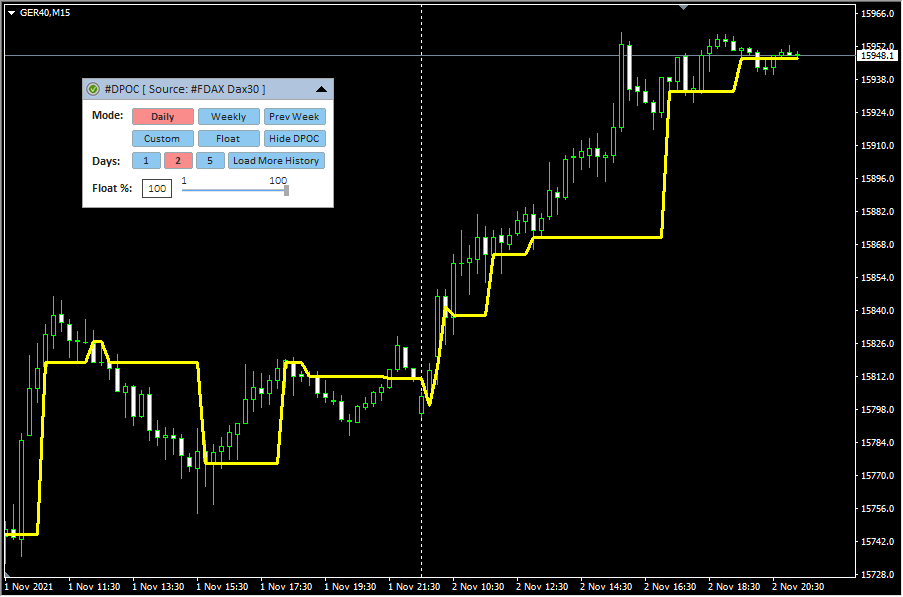
The #DPOC indicator is a change of the POC level over time, where the calculation point is the maximum volume level (POC = Point Of Control). This indicator shows the previous positions of the maximum volume, which allows you to understand the its evolution.
The general idea of the indicator is that you can see the evolution of the volume profile in the period in terms of change of the price of maximum volume accumulation (POC). Quite often, some minutes before market close, large enough volumes comes out (due to overnight margins increasing ), which distort the actual levels of the maximum volume at the end of the day, so this indicator indicates the significance of the price level in the period.
#DPOC sometimes allows you to detect levels "hidden" by time, describing the movement of volume within a day or week. This indicator allows you to build charts of dPOC changes in series.
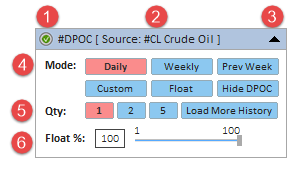
Description of graphic control panel
-
1 - authorization status (for more details on authorization, see the How to install and use indicators section)
- Daily - from the start of Globex trading until the break, 00:00-23:59 GMT+2 (the number of days can be changed using point #5)
- Weekly - from the start of Globex trading on Monday until break on Saturday. (the number of weeks can be changed using point #5) .
- Prev Week - the Prev Week period will be calculated as exclusively the entire previous week (the week is counted from Monday to Sunday)
- Custom - two vertical lines will appear on the chart, which limit the period. They can be freely moved around the chart using the mouse
- Float - this mode is an addition to the previous periods of construction together with the value from item #6 of the graphic panel (Float%). When this mode is activated, the profile is built using the percentage of the floating volume. For more details see #6
- Hide DPOC / Show DPOC - remove/show DPOC line from/on the chart
2 - the name of the indicator and the instrument - the data source. Using Drag & Drop, you can move the panel along the chart (to activate the panel, you may need to double-click the mouse)
3 - the icon to Expand/Collapse graphic panel
4 - indicator building mode corresponding to the input parameter DPOC_Period.
5 (Qty) - the number of periods for building the indicator corresponding to the input parameter Amount_of_DPOCs. The values 1, 2, 5 correspond to the number of the daily or weekly periods. The "Load More History" button additionally loads the current amount periods of history
6 (Float %) - a percentage of the total volume that is used to calculate the period. The concept is based on the approach that the further the volume in history, the less its influence on the current events. Considering that the #DPOC indicator calculates data from the beginning of the period candle by candle - calculating the value with the Float parameter uses only the specified percentage of volume of the entire period starting from the end (from the recent bar), thus, it removes the past volume from calculation.. Note that the concept of volume cut-off requires additional research. To change the Float parameter, you need to move the slider or change its value in the text field. After changing the value of this parameter, an additional button will appear to the right of the slider with a new value and a "?" - to apply a new value, click on this button.
You can hide the panel completely from the screen with the "Z" button - pressing it again will return the panel display.
The F5 button allows you to reinitialize the coordinates of the panel based on the current size of the chart window (it helps if the panel has disappeared from the workspace). Please note that resetting coordinates will not display the panel that is already hidden by the Z button or by the input "GUI" parameter.
When adding an indicator to a chart, priority is given to the input parameters. However, after making changes to the settings through the graphic panel, the indicator takes the current parameters from the graphic panel when the timeframe changes. In some cases, removing and re-attaching an indicator will help to solve a specific problem.
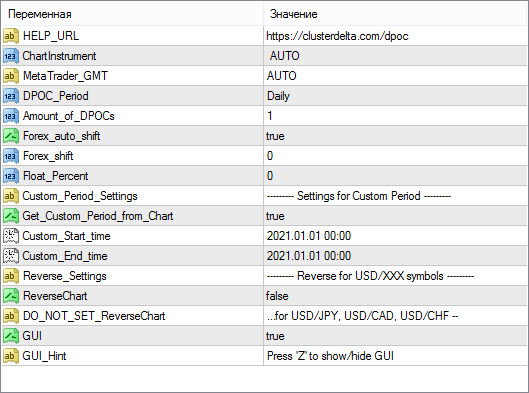
Description of indicator inputs:
- HELP_URL (default value "https://clusterdelta.com/dpoc") - this is the URL where you can get the full description of the indicator.
- ChartInstrument - select a futures from the dropdown list as the source for data. Value AUTO causes automatic detection of the instrument by the MT ticker.
- MetaTrader_GMT - the GMT value of your Metatrader. In 95% of cases leave AUTO.
- DPOC_Period (default value is "Daily") - the period of building DPOC. You can build a DPOC series using the Amount_of_DPOCs parameter or using the graphical panel.
- Custom_Period - custom mode, when DPOC is built for the period from Custom_Start_time to Custom_End_time or for the period obtained from the vertical lines of the chart (depending on the value of Get_Custom_Period_from_Chart)
- per_Hour - DPOC building period is a hour
- Daily - DPOC building period is a day (from start trading after market break)
- Weekly - DPOC building period is a week (from start trading after market break on Monday to start break on Saturday)
- per_Asia - building period is 00:00 - 09:00 GMT+2
- per_Europe - building period is 09:00 - 15:00 GMT+2
- per_NYSE - building period is 15:00 - 24:00 GMT+2
- per_CME - building period is 16:30 - 23:30 GMT+2
- per_Contract - build period will be defined as the entire current contract since the last rollover
- Amount_of_dPOCs (default value is "1") - the number of DPOC to build in the series. In order to optimize the load, the maximum value is 30. You can increase the amount on the chart through the graphic panel (button "Load More History")
- Forex_auto_shift (default value is "true") -if true, the indicator automatically determines the offset between futures and forex prices (basis).
- Forex_Shift - the number of points by which the indicator data will move up or down if the Forex_auto_shift parameter is set to "false". The value can be greater than or less than zero. It is intended to take into account the forward points (the difference between the price of the futures and the spot). It should be indicated as distance in the pips (according to the MetaTrader instrument specification).
- Float_Percent - floating volume value. The general idea of the floating volume is described in the description of the graphic panel in paragraph #6
- Custom_Period_Settings (значение по умолчанию "--- Settings for Custom Period ") - just a comment describing inputs below
- Get_Custom_Period_from_Chart (default value is "true") - with the DPOC_Period = Custom_Period parameter, the indicator will get data for the Custom_Start_Time and Custom_End_Time fields directly from the vertical lines placed on the chart
- Custom_Start_time, Custom_End_time (default value is "2021.01.01 00:00") - if Custom_Start_Time and Custom_End_Time differ from "2021.01.01 00:00", and Get_Custom_Period_from_Chart is false, and DPOC_Period is Cusom_Period the server loads data for the period specified by these parameters
- ReverseChart (default value is "false") - for reverse currency pairs with names that differ from "USD/JPY", "USD/CAD", "USD/CHF", the value must be "true" to flip indicator data according to the direction of the price chart
- DO_NOT_SET_ReverseChart (for"...for USD/JPY, USD/CAD, USD/CHF --") - the comment in the inputs about the information describe above
- GUI (default values is "true") - flag indicating the need to draw a graphical user interface (control panel)
- GUI_Hint - using the keyboard : press "Z" to show/hide a graphical control panel
DPOC_Period possible values:
For a better understanding, there is a short video about how the DPOC chart is formed in time based on the volume profile during the day. The red line indicates the moment during the day when the DPOC was calculated. DPOC is always the same level as the maximum volume of the profile for a given period.