
")

Indicator Name: ClusterDelta_#VWAP
Indicator VWAP - Volume Weighted Average Price (VWAP). In finance, volume-weighted average price (VWAP) is the ratio of the volume traded to the total volume traded over a particular time period (usually one day). It is a measure of the average price a derivative traded at over the trading period.
VWAP is often used as a trading benchmark by investors who aim to be as passive as possible in their execution. Many pension funds, and some mutual funds, fall into this category. The aim of using a VWAP trading target is to ensure that the trader executing the order does so in-line with volume on the market. It is sometimes argued that such execution reduces transaction costs by minimizing market impact (the adverse effect of a trader's activities on the price of a security).
WAP can be measured between any two points in time but is displayed as the one corresponding to elapsed time during the trading day by information provider.
VWAP is often used in algorithmic trading. Indeed, a broker may guarantee execution of an order at the VWAP price and have a computer program enter the orders into the market in order to earn the trader's commission and create P&L. This is called a guaranteed VWAP execution. The broker can also trade in a best effort way and answer to the client the realized price. This is called a VWAP target execution; it incurs more dispersion in the answered price compared to the VWAP price for the client but a lower received/paid commission. Trading algorithms that use VWAP as a target belong to a class of algorithms known as volume participation algorithms.

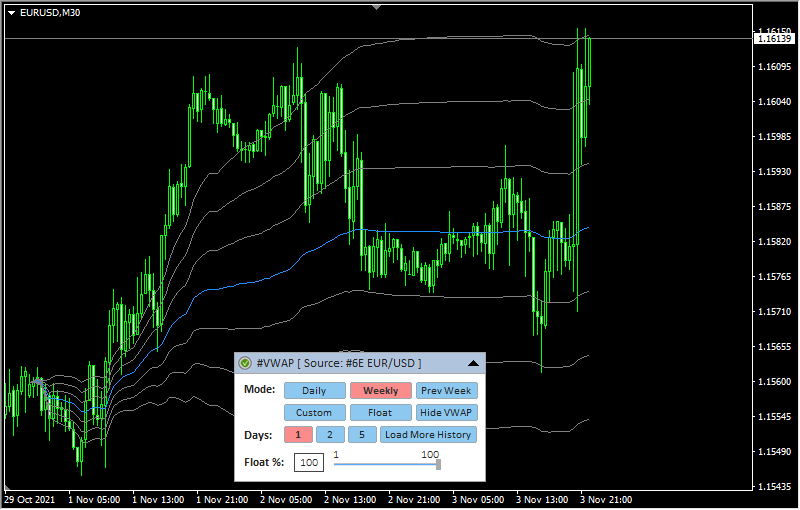
Description of graphic control panel
-
1 - authorization status (for more details on authorization, see the How to install and use indicators section)
- Daily - from the start of Globex trading until the break, 00:00-23:59 GMT+2 (the number of days can be changed using point #5)
- Weekly - from the start of Globex trading on Monday until break on Saturday. (the number of weeks can be changed using point #5) .
- Prev Week - the Prev Week period will be calculated as exclusively the entire previous week (the week is counted from Monday to Sunday)
- Custom - two vertical lines will appear on the chart, which limit the period. They can be freely moved around the chart using the mouse
- Float - this mode is an addition to the previous periods of construction together with the value from item #6 of the graphic panel (Float%). When this mode is activated, the profile is built using the percentage of the floating volume. For more details see #6
- Hide VWAP / Show VWAP - remove/show DPOC line from/on the chart
2 - the name of the indicator and the instrument - the data source. Using Drag & Drop, you can move the panel along the chart (to activate the panel, you may need to double-click the mouse)
3 - the icon to Expand/Collapse graphic panel
4 - indicator building mode corresponding to the input parameter VWAP_Period.
5 (Qty) - the number of periods for building the indicator corresponding to the input parameter Amount_of_VWAPs. The values 1, 2, 5 correspond to the number of the daily or weekly periods. The "Load More History" button additionally loads the current amount periods of history
6 (Float %) - a percentage of the total volume that is used to calculate the period. The concept is based on the approach that the further the volume in history, the less its influence on the current events. Considering that the #VWAP indicator calculates data from the beginning of the period candle by candle - calculating the value with the Float parameter uses only the specified percentage of volume of the entire period starting from the end (from the recent bar), thus, it removes the past volume from calculation.. Note that the concept of volume cut-off requires additional research. To change the Float parameter, you need to move the slider or change its value in the text field. After changing the value of this parameter, an additional button will appear to the right of the slider with a new value and a "?" - to apply a new value, click on this button.
You can hide the panel completely from the screen with the "Z" button and show it again with "X" button.
The F5 button allows you to reinitialize the coordinates of the panel based on the current size of the chart window (it helps if the panel has disappeared from the workspace). Please note that resetting coordinates will not display the panel that is already hidden by the Z button or by the input "GUI" parameter.
When adding an indicator to a chart, priority is given to the input parameters. However, after making changes to the settings through the graphic panel, the indicator takes the current parameters from the graphic panel when the timeframe changes. In some cases, removing and re-attaching an indicator will help to solve a specific problem.

Description of indicator inputs:
- HELP_URL - this is the URL where you can get the full description of the indicator.
- Select Futures from List - select a futures from the dropdown list as the source for data. Value AUTO causes automatic detection of the instrument by the MT ticker.
- MetaTrader_GMT - the GMT value of your Metatrader. In 95% of cases leave AUTO.
- VWAP_Period - the period of building VWAP. You can build a VWAP series using the Number_of_VWAPs parameter or using the graphical panel.
- Custom_Period - custom mode, when DPOC is built for the period from Custom_Start_time to Custom_End_time or for the period obtained from the vertical lines of the chart (depending on the value of Get_Custom_Period_from_Chart)
- per_Hour - DPOC building period is a hour
- Daily - DPOC building period is a day (from start trading after market break)
- Weekly - DPOC building period is a week (from start trading after market break on Monday to start break on Saturday)
- per_Asia - building period is 00:00 - 09:00 GMT+2
- per_Europe - building period is 09:00 - 15:00 GMT+2
- per_NYSE - building period is 15:00 - 24:00 GMT+2
- per_CME - building period is 16:30 - 23:30 GMT+2
- per_Contract - build period will be defined as the entire current contract since the last rollover
- Number_of_VWAPs - the number of VWAP to build in the series. In order to optimize the load, the maximum value is 30. You can increase the amount on the chart through the graphic panel (button "Load More History")
- Forex_auto_shift - if true, the indicator automatically determines the offset between futures and forex prices (basis).
- Forex_Shift - the number of points by which the indicator data will move up or down if the Forex_auto_shift parameter is set to "false". The value can be greater than or less than zero. It is intended to take into account the forward points (the difference between the price of the futures and the spot). It should be indicated as distance in the pips (according to the MetaTrader instrument specification).
- Float_Percent - floating volume value. The general idea of the floating volume is described in the description of the graphic panel in paragraph #6
- Custom_Period_Settings - just a comment describing inputs below
- Get_Custom_Period_from_Chart - with the DPOC_Period = Custom_Period parameter, the indicator will get data for the Custom_Start_Time and Custom_End_Time fields directly from the vertical lines placed on the chart
- Custom_Start_time, Custom_End_time - if Custom_Start_Time and Custom_End_Time differ from their default values, and Get_Custom_Period_from_Chart is false, and DPOC_Period is Cusom_Period the server loads data for the period specified by these parameters
- Deviation_Settings - just a text comment describing the deviation multipliers for channels. The "0" value on numDev option causes to not use current channel in drawings.
- numDev1 (default value is "1") - multiplier to build 1st channel.
- numDev2 (default value is "-1") - multiplier to build 1st channel
- numDev3 (default value is "2") - multiplier to build 2nd channel
- numDev4 (default value is "-2") - multiplier to build 2nd channel
- numDev5 (default value is "3") - multiplier to build 3rd channel
- numDev6 (default value is "-3") - multiplier to build 3rd channel
- numDev7 (default value is "0") - multiplier to build 4th channel
- numDev8 (default value is "0") - multiplier to build 4th channel
- Alert_VWAPCross - if true, generates a sound alert when the current price crosses the VWAP line
- Alert_onDeviations - if true, generates a sound alert when the current price crosses the channels build on deviations multipliers.
- Alert_PushMessage - if true, generates a push message to your mobile device connected by MetaQuotes ID in the opionts.
- Alert_Color - the color of the alert text on the chart when vwap alert is triggered.
- Alert_Numbers - the amount of the alert events (play sound / show text / push message) for the each triggered alert .
- Alert_Interval_sec - the delay between alert events of the one triggered alert.
- Alert_Filename - the name of the sound file in MT\Sounds folder (without ".wav" extension).
- ReverseChart - for reverse currency pairs with names that differ from "USD/JPY", "USD/CAD", "USD/CHF", the value must be "true" to flip indicator data according to the direction of the price chart
- DO_NOT_SET_ReverseChart (for"...for USD/JPY, USD/CAD, USD/CHF --") - the comment in the inputs about the information describe above
- GUI_Show - flag indicating the need to draw a graphical user interface (control panel)
- GUI_Hint - usage of hot keys. Press 'Z' to hide / 'X' to show GUI
VWAP_Period possible values:

