
")
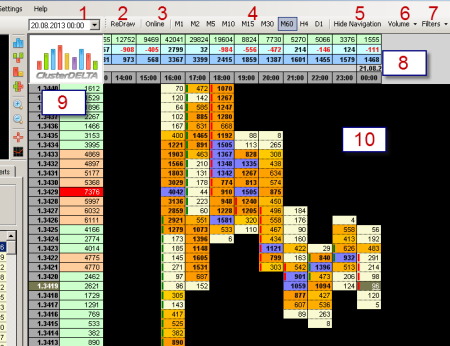
1. The date / time as of which the chart will be displayed (and loaded additionally if necessary as well)
2. "Redraw" – the button for the chart redrawing according to p.1. Pay attention that the date and time should be specified correctly. If the date is not within the already loaded data, the platform will download the data again (for the length of the history set in the upper menu Settings-> History Length)
3. "Online" - the button for the workspace fast navigation to the last cluster.
4. Selects the time interval (timeframe) for the chart in the workspace.
5. Hides the left panel increasing the workspace
6. Switches modes Volume / Delta / Volume x Delta / Ask x Bid
7. Applies filters to display data.
8. The summary information on the data from up to down: volume per cluster, delta per cluster (total of purchases minus sales), cumulative delta
9. The price is on the left and the total volume at each price for the period indicated in the Prices tab, p.16 (screen below) is on the right. The highlighted price shows the last known price of ClusterDelta or simply saying the current price.
10. The cluster chart (another way to display a candlestick chart, where per each price information on the number of volume closed trade contracts arranged by time is recorded)
The highlighting of the volume next to the price scale (№ 9) is as follows: the program selects the highest value and highlights the background according to Max Volume koef and Minor Volume koef parameters (can be changed in the Settings menu)
The cluster chart uses Minor Volume Filter and Major Volume Filter values. The values less than Minor Filter get background from the Cluster Background. The values between Minor and Major filters make a gradient from the corresponding color parameters. The values higher than Major will be highlighted in one color, while the font will be bold, but these color settings can be changed if the current value is very high in the cluster (higher than Max Volume koef of the maximum value in the cluster).

