
")
Indicator Name: ClusterDelta_#OHLC_Chart
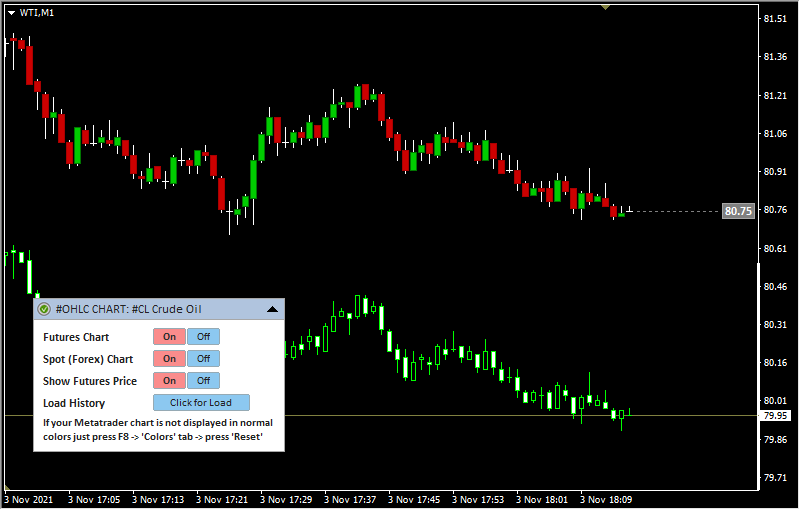
The indicator is designed to demonstrate a futures chart over a spot chart. This will make it possible to see the correlation between the two charts, determine the value of forex_shift, or use indicators directly on the futures chart.
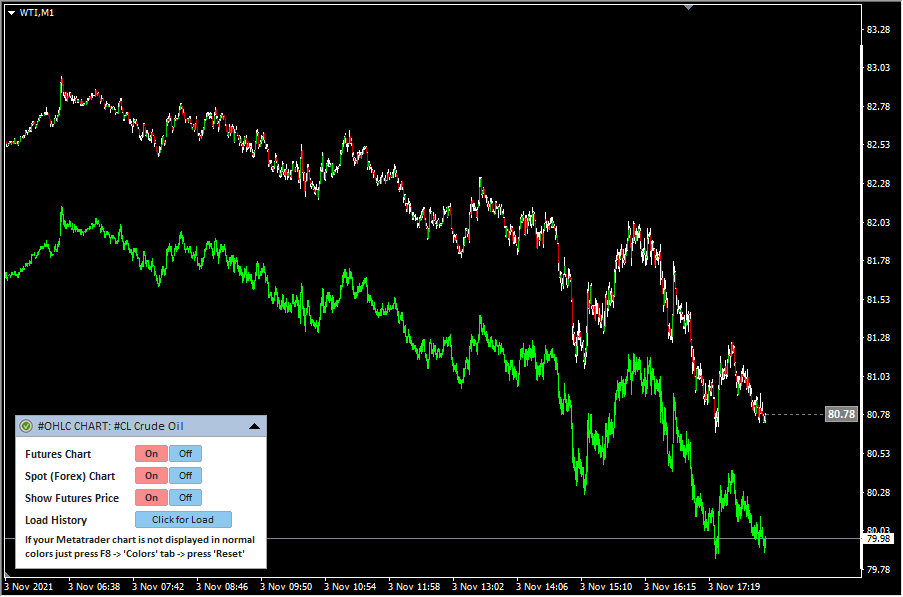
The #OHLC_Chart indicator loads the futures chart over the native forex/spot chart. It is very important that the tick size of the spot chart matches the tick size of the futures in the number of decimal places after the point.
Sometime, a spot may move differently from a futures, and if the spot is analyzed through the the futures data, a data inconsistency may be found. This indicator will help to understand where these inconsistency are located and to analyze the reasons.
All ClusterDelta indicators are based on futures data; therefore, if you wish, you can turn off the spot correction (forex_shift_auto / forex_shift inputs) and use them directly with futures charts.
This indicator has a graphical panel with interactive options for displaying and disabling the futures / spot chart, and also the option to display or hide the current futures price.
In some cases, if weird changes have occurred in the color scheme of the chart during the functionality of the indicator, the color scheme can be returned by pressing the F8 button, selecting the color tab and in the lower right corner press the "Reset" button
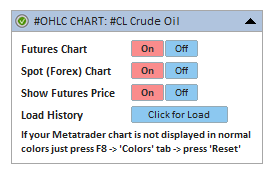
Description of graphic panel:
- Futures Chart - display / hide the futures chart in the workspace
- Spot (Forex) Chart - display / hide the spot chart in the workspace. The spot chart is a native chart that provided by MetaTrader
- Show Futures Price - display / hide the current futures price
- Load History - loading more history of futures chart
You can hide the panel completely from the screen with the "Z" key and show it again with "X" key.
The F5 button allows you to reinitialize the coordinates of the panel based on the current size of the chart window (it helps if the panel has disappeared from the workspace). Please note that resetting coordinates will not display the panel that is already hidden by the Z button or by the input "GUI" parameter.
When adding an indicator to a chart, priority is given to the input parameters. However, after making changes to the settings through the graphic panel, the indicator takes the current parameters from the graphic panel when the timeframe changes. In some cases, removing and re-attaching an indicator will help to solve a specific problem.
Description of graphic panel:
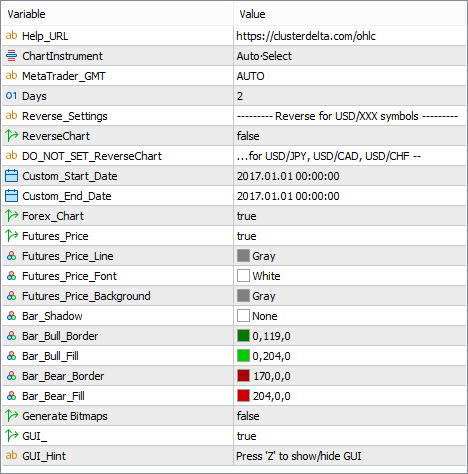
- Days (значение по умолчанию "5") - the number of days to load data of the chart.
- HELP_URL - this is the URL where you can get the full description of the indicator.
- Select Futures from List - select a futures from the dropdown list as the source for data. Value Auto Select causes automatic detection of the instrument by the MT ticker.
- MetaTrader_GMT - the GMT value of your Metatrader. In 95% of cases leave AUTO.
- Days - the number of days for data loading .
- ReverseChart - for reverse currency pairs with names that differ from "USD/JPY", "USD/CAD", "USD/CHF", the value must be "true" to flip indicator data according to the direction of the price chart
- DO_NOT_SET_ReverseChart (for"...for USD/JPY, USD/CAD, USD/CHF --") - the comment in the inputs about the information describe above
- Custom_Start_time, Custom_End_time (default value is "2021.01.01 00:00") - if Custom_Start_Time and Custom_End_Time differ from their default values, the server loads data for the period specified by these parameters
- Forex_Chart (по умолчанию "true") - display / hide the spot chart .
- Futures_Price (по умолчанию "true") - display / hide the current futures price .
- Futures_Price_Line - line color from the futures chart to the current futures price object
- Futures_Price_Font - font of the current futures price
- Futures_Price_Background - background of the current futures price
- Bar_Shadow - background color for candle shadows (better to use the value "None" as transparent background)
- Bar_Bull_Border - border color for the bull candle
- Bar_Bull_Fill - filling color for the bull candle
- Bar_Bear_Border - border color for the bear candle
- Bar_Bear_Fill - filling color for the bear candle
- Generate Bitmaps - there are two options to generate the chart, the MT objects such as a Lines or drawing using Bitmaps objects. The last one is looking more accurate because to draw rectangles the lines are used and they are rounded on the high/low. The same time bitmaps are processing much slower than Lines
- GUI (default values is "true") - flag indicating the need to draw a graphical user interface (control panel)
- GUI_Hint - using the keyboard : press "Z" to show/hide a graphical control panel
The most important option of OHLC indicator is the possibility to check on how futures differs from the spot chart. Just drag the price up/down to move the chart together with a price box. Two arrows appeared near the prices indicates that the futures chart was moved from its original prices.
Each candle has its own tooltip that shows Time, OHLC prices, Volume/Delta and difference between futures prices and spot prices between their high and low prices.

