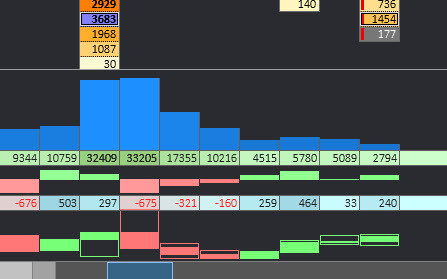
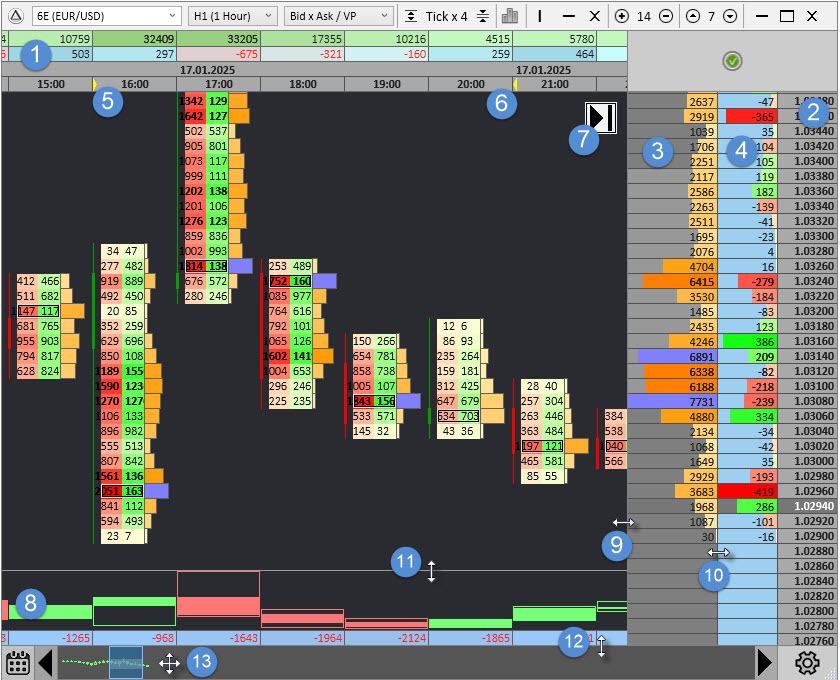
- Header Indicators
- Prices
- Volume Profile
- Delta Profile
- Start Time Mark of Volume Profile Calculation
- End Time Mark of Volume Profile Calculation
- Switch to "Auto" Mode
- Footer Indicators
- Volume Profile Resize Option
- Delta Profile Resize Option
- Footer Indicator Histogram Resize Option
- Navigation Toolbar Resize Option
- Quick Navigation
If you want to get information about what the unmarked (on the image above) icons and buttons of the app are responsible for, just go to the Interface section, where everything is described in details.
1. Header Indicators

The top area of the workspace is used by Header Summary Indicators that may be called on Indicators window. The full list of Header indicators includes Volume, Delta, Cumulative Delta, Min/Max Delta. The Date and Open Time of the bar are also may be included as part of the Header Indicators. Dragging by Indicator area allows to move application window among desktop and clicking to a Header Time panel switches the Start/End period of Volume/Delta Profile. The details about the indicators data are in Indicators section.
2. Prices
There are no any magic in the prices panel. It just shows prices on Y-axis with a step that is equal to the Instrument tick size (min step of price change on real market) multiplied to the Tick Multiplier value
3. Volume Profile
Volume Profile shows data defined by the time range in the Indicators -> Market Profile section as a summarized value of volumes on the same price levels for the defined time period.
4. Delta Profile
Delta Profile shows data defined by the time range in the Indicators -> Market Profile section. It's a summarized value of each delta on the same price levels for the defined time period.
5-6. Volume Profile Start/End Time Mark
Yellow marks define the Start and End time of the market profile calculation period. This allows you to select any custom period for calculation. Start time is a yellow mark pointing to the right, to change its position use the left mouse button on the time panel in the header indicators panel. The end time is a yellow mark pointing to the left, to change its position use the right mouse button on the time bar in the time indicator panel. The end time yellow mark locates at the beginning of the bar, which is not included in the calculations. You can place the End Time mark after the last bar of the chart to use all data from the Start period.
7. Switch to "Auto" Mode
This feature enables users to activate "Auto" mode, which automatically adjusts the chart to reflect the current price. In this mode, the chart shifts to ensure the price remains within the visible area of the workspace. Users can also activate this mode using the hot key End. If the chart position is altered by any keyboard or mouse interaction, the mode will switch to "Manual" until "Auto" mode is re-enabled.
8. Footer Indicators

The bottom area of the workspace is used by Footer Indicators that you can access from the Indicators window. The full list of Footer indicators includes Volume, Delta, Cumulative Delta, Min/Max Delta. The Volume / Delta / Cum.Delta indicators also have the option to visualize their data as the histograms with or without the panel with absolute values. The Date and Open Time of the bar are also may be included as part of the Footer Indicators. Just remember that clicking on a Footer Time panel does not do anything compared to the same action on a Header Time panel that applies to a Volume/Delta Profile. The details about the indicators data are in Indicators section.
Resize Options
Hovering the Volume Profile left edge 9 changes the mouse cursor to ↔ arrows. Dragging it allows you to change the width of the Volume Profile area.
Hovering the Delta Profile left edge 10 changes the mouse cursor to ↔ arrows. Dragging it allows you to change the width of the Delta Profile area.
Hovering the Footer Indicator histogram top edge 11 changes the mouse cursor to ↕ arrows. Dragging it allows you to change the height of the histogram area. It applies only to a current indicator histogram only. Each indicator histogram may be resized separately.
Hovering the Navigation Toolbar top edge 12 changes the mouse cursor to ↕ arrows. Dragging it allows you to change the height of the Navigation Toolbar.
13. Quick Navigation
Moving mouse with pressed left mouse button allows you to navigate the chart quickly among the loaded data. The more detailed information about Navigation Toolbar you can find at the Interface -> Navigation Toolbar section.


