
")
Indicator Name: ClusterDelta #Bookmap
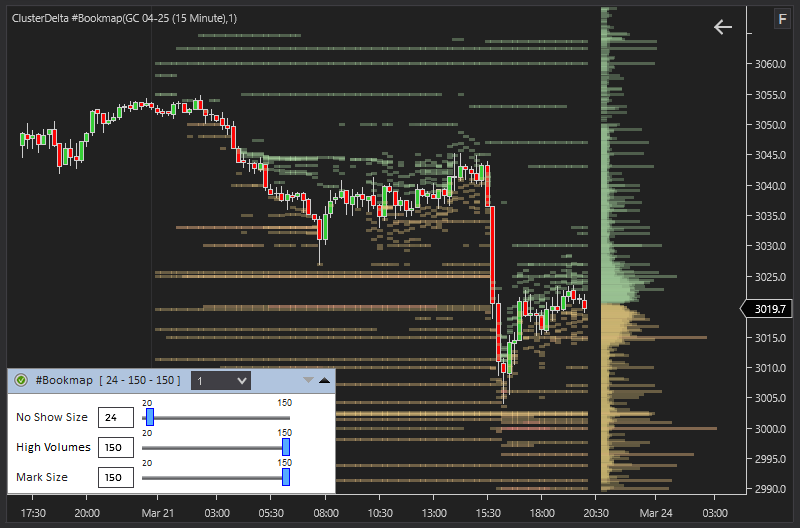
The #BookMap indicator shows pending orders that are visible in the order book (DOM). This indicator captures the levels every minute and displays them on the screen, where the color saturation indicates relative volume.
While the indicator works only on the following instruments: AUD, GBP, EUR, Gold, Silver, CL Oil, Natural Gas, S&P500, Nasdaq 100, Dow Jones 30, Natural Gas.
Recall that each trade is a market orders with counter order from the offer (SELL LIMIT is higher than the ASK price and BUY LIMIT is lower than the BID price). Pending orders also can be seen in the #TS_DOM indicator in a stream mode but limited with amount of 10 price steps for each side.
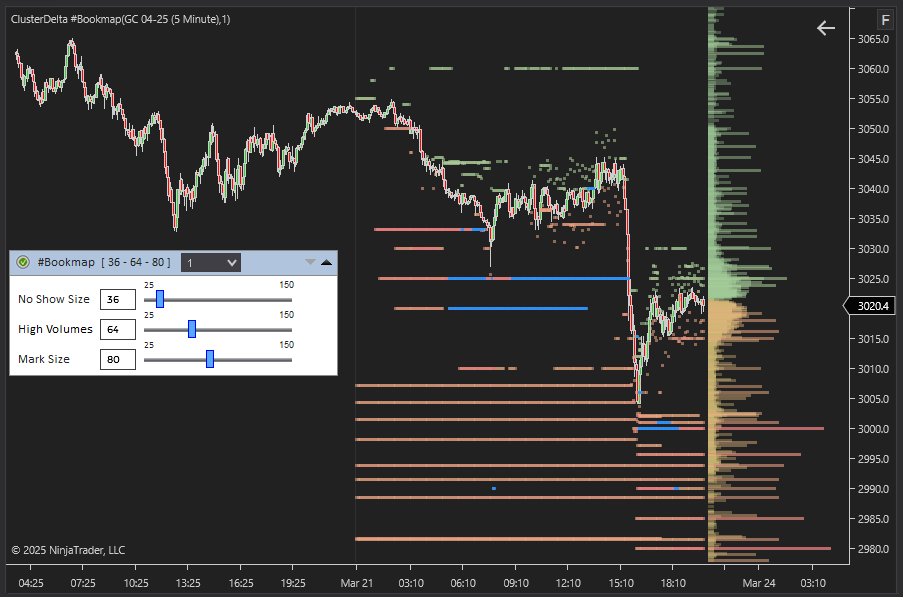
The data is displayed as a color scale, where the color saturation depends on the size of the volume. Also, the "cut-off" of a large volume indicates especially large volume sizes by blue (for sales) and red (for purchases) bands.
DESCRIPTION OF THE BOOKMAP INDICATOR PANEL
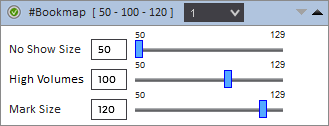
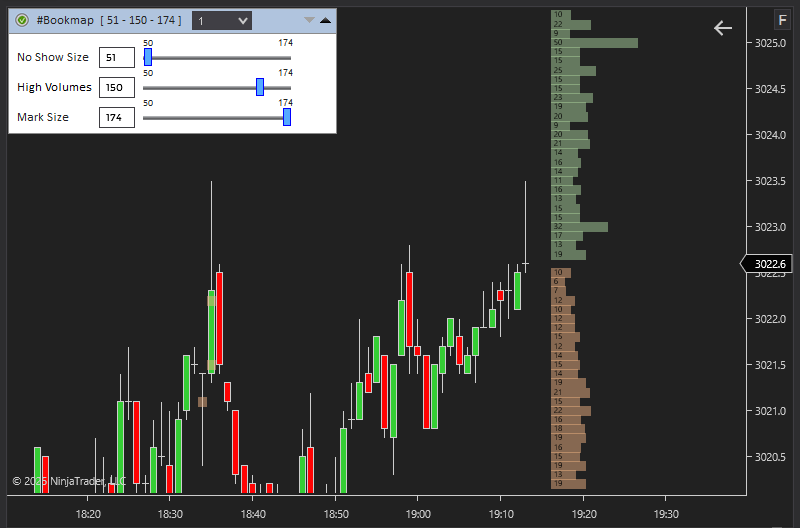
The header of the Bookmap panel contains the "Authorizer" icon, the indicator name and visibility options [ No Show Size - High Volumes - Mark Size ], the number of days to load and display, where the value "None" removes Bookmap data from the chart, an icon (arrow down) to open an advanced panel and next icon (arrow up) to close the advanced panel and the Bookmap GUI panel completely.
The Bookmap Indicator was optimize for speed but remember that on minimum zoom and minimum timeframe it require to draw hundreds thousands objects that can decrease the speed of the terminal. Using the normal zoom will avoid such an issues
CLUSTERDELTA BOOKMAP INPUTS DESCRIPTION
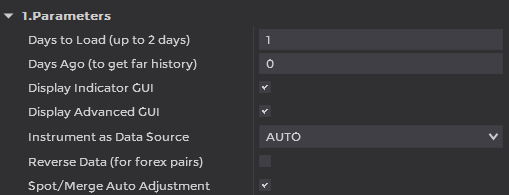
Parameters
Days To Load (up to 5 days) is the number of the days to load in history. To not overload server side do not use the big values. The "0" value uses the entire period that is loaded by NinjaTrader. Use the "Data Series" NT option (Ctrl+F) to change it.
Days Ago (to get far history) is the option to work with history data. It determines the number of days to skip from the current date and then load the required historical data using the "Days to Load" setting from the Common Settings.
Display Indicator GUI is a small graphical panel containing current access status (click to open the Authorizer), name of the indicator, Imbalance coefficients, the ticker name of the data source and the alert icon
Display Advanced GUI shows or hides the Advanced Panel on start
Instrument as Data Source - select a futures from the dropdown list as the source for data. Value AUTO causes automatic detection of the instrument using the NinjaTrader ticker.
Reverse Data is an option for reverse the indicators data (Ask ↔ Bid) for reversed currency pairs except those that have name "USDJPY", "USDCAD", "USDCHF", "USDMXN". This option was added for compatibility, but in 99.9% of NinjaTrader cases keep it turned off.
Spot/Merge Auto Adjustment is an option that allows you to adjust Bookmap data to the spot chart using the latest highs and lows of the current trading session. The difference that is automatically calculated using this option may vary from trading session to trading session, so this may result in incorrect alignment of Bookmap data for different trading sessions.
Bookmap Settings
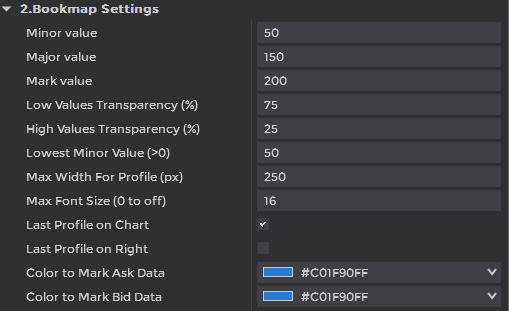
Minor Size is the filter to not display the Bookmap objects which volume values are less than this option.
Major Value is the filter to display the Bookmap values [No Show] - [High Volumes] with a gradient scale and volumes above the [High Volumes] are displayed using the same color (last color in the gradient scale).
Mark Size is the filter to display the Bookmap values above [Mark Size] with additional borders.
Low Values Transparency (%) is the option of the color transparency of the objects which values are smaller than a middle point between [No Show Size] and [High Volumes] to get better visualization on Low and High Volume Values.
High Values Transparency (%) is the option of the color transparency of the objects which values are largeer than a middle point between [No Show Size] and [High Volumes] to get better visualization on Low and High Volume Values.
Lowest Minor Value is the minimum volume filter to load the Bookmap data from the servers. The values less than lowest (except Last Profile) are not included in the result for an Indicator query.
Max Width for Profile (px) is the part of the current chart window that will be used to draw a Bookmap profile.
Max text size is the maximum text size that will be used to display the Bookmap values when the Ninjatrader scale of the chart will be large enough that the height of the Bookmap profile object will allow the text to fit inside. Min Font Size is 6
Last Profile on Chart is the option to put the last known values of the Bookmap data as the Bookmap profile right to the last bar.
Last Profile on Right is the option to put the last known values of the Bookmap data as the Bookmap profile linked to a right border of the window with the profile lines direction from right to left.
Color To Mark Ask Data is the border color of the volumes above the last known price (Close price) of the calculated bar that are above the "Mark Size"
Color To Mark Bid Data is the border color of the volumes below the last known price (Close price) of the calculated bar that are above the "Mark Size"
Color Gradient as Fx(sin)
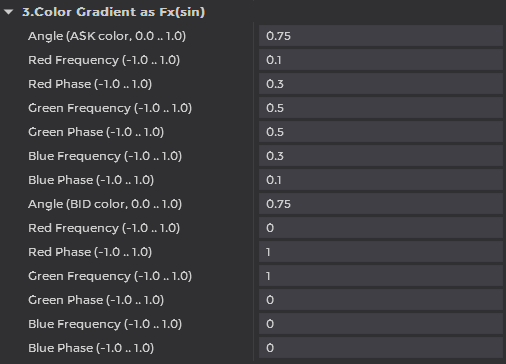
The final color is based on the value within the range of the [No Show Size] and [High Volumes] settings, based on the gradient scale created by the "Fx(sin)" section settings. The values above [High Volumes] use the last color of the gradient scale, but the volumes above [Mark Size] use the colors described above. The gradient function is based on the sinusoidal gradient function, so just change the Angle / Frequency / Phase options that will change the colors of the gradient scale.
A high chart scale can display the absolute values of the Bookmap profile. The values will be displayed automatically when the cell height allows to draw text using Font Size from Bookmap Settings.
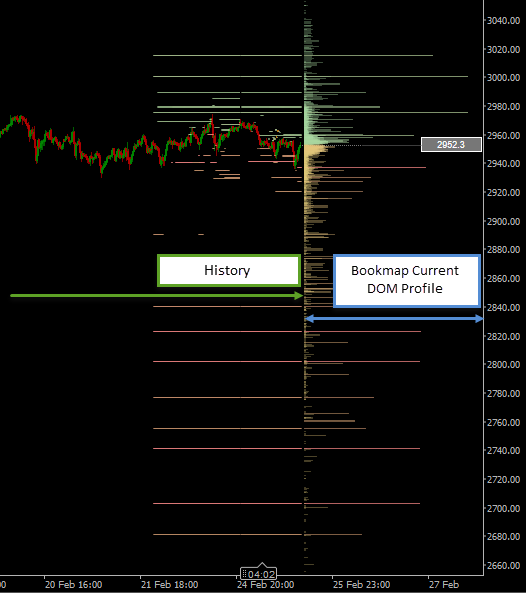
The low scale of the chart shows the full depth of Bookmap data, which may be far away from the chart but shows its current state. Note that the profile to the right of the chart shows the last known values and how they relate to each other, while the history area can only show correspondence by color shades.
Join us on ClusterDelta Discord channel and follow us in the Instagram: @clusterdeltatools

