
")
Indicator Name: ClusterDelta_#Footprint
Footprint is a type of the chart where you can see sum of the traded volumes at a specified price for a certain period. Commonly the Footprint term is used with the term Order Flow.
The #Footprint indicator allows us to see accumulation and distribution of market volumes. This gives us to conduct accurate analysis based on how the markets were traded.
The main functionality includes:
- 25+ wide known market derivatives (exchanges, energy, metals, indexes ) and 20 crypto assets
- Timeframes Charts from M1 to Weekly
- Custom Range-bar charts
- Built-in Market profiles, POC, Value Area, Imbalances
- Order flow charts mode: Volume, Delta, Bid x Ask and it is allowed to build custom charts
The main advantages are
- Graphic user-friendly interface
- High performance of data update and data redrawing
- Scaling charts for high-volatility markets
- Custom chart settings for current purposes
ClusterDelta #Footprint indicator for MetaTrader is a very powerful tool, and we strongly recommend that you take some time to understand its functionality and settings to find out all the possibilities that the indicator can show you. At the same time, the interface is very intuitive. For now ClusterDelta was released the different versions for the different trading terminals. The Footprint is ready for such trading terminal as MetaTrader, cTrader, NinjaTrader and there is the ClusterDelta Orderflow Application for Windows and MacOS. All of these products has the same idea and the same data source but functionality may be a little bit different from terminal to terminal. ClusterDelta Orderflow App and ClusterDelta_#Footprint for MetaTrader are compatible to Import/Export settings between them .
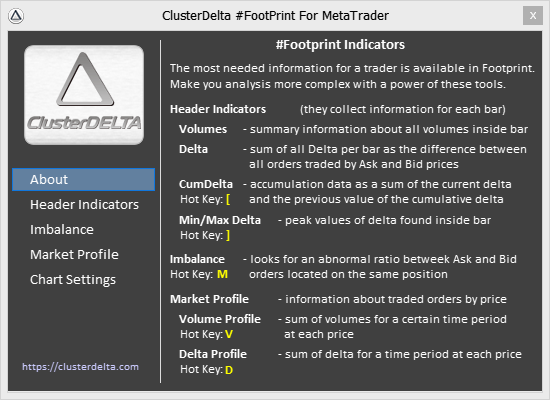
If you just downloaded the indicator and ready to start to use it, please do not forget to put your ClusterDelta username and password into the Authorizer as it mentioned on How To Install page. The Authorizer icon on the right top corner of indicator workspace. A green authorization icon means that authorization was successful. An orange icon means the subscription will expire in less than 3 days. A red icon indicates that the subscription was not found (or the user is not authorized). The blue icon asks that the current authorization status is not loaded yet
Description of the functionality will be divided for 4 sections:
- Description of the Footprint workspace
- Title Toolbar Description
- Indicators Window
- Description of the Indicator settings (Inputs Tab in the Indicator properties)
- Common Settings
- Internal Indicator Settings
- Chart Builder
DESCRIPTION OF THE FOOTPRINT WORKSPACE
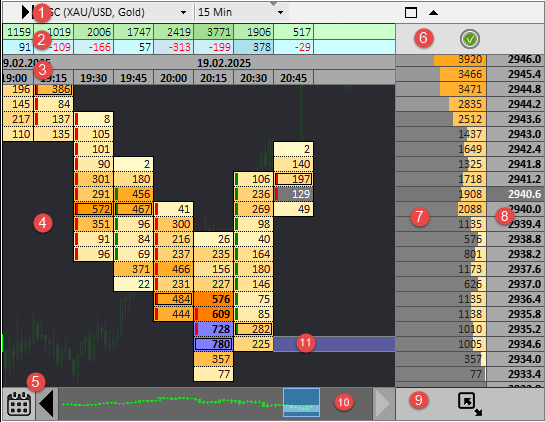
- Title Toolbar is a collection of the drop-down lists and buttons to do the quick actions such as change some options that immediately applied on chart .
- Summary Indicators Area is a position on the top of the chart workspace for the summary data such as Volumes/Delta/CumDelta/Min.Max.Delta
- Date / Time panel to show the date and open time of each bar
- Chart Area to draw main orderflow chart
- Calendar Icon to call calendar window to choose history data for data loading
- Authorizer Icon to call the Authorizer window to check your subscription status
- Volume / Delta Profile Indicators Area to see the summary data by prices
- Prices Area showing tick change and current price
- Resize Icon to change the actual size of the workspace
- Navigation Toolbar Panel for quick navigation on chart by dragging the blue window
- Drawing Objects that may be put on the chart to visualize some levels
Dragging the "Title Toolbar" or "Summary Indicators" Area moves Footprint Workspace in the Chart Window.
Dragging the Volume Profile Indicator area resizes Footprint workspace horizontally.
Dragging the Resize Icon resizes Footprint window vertically and horizontally.
On the Navigation toolbar, dragging the Blue Box horizontally and the Light Blue Box vertically moves the chart in the workspace.
Dragging the the bottom border of the Navigation Toolbar resizes it vertically.
Click to Arrows in the Navigation Toolbar moves the chart to one screen left/right.
Click to Black Arrow on White background (you can find it in the image at the top of the page, the icon on the graphic in the upper right corner) moves chart to the last bar and activates Online mode.
The indicator automatically loads new data when it reaches its bounds of the loaded data. You can use built-in calendar to select a start date. There are data from Jan, 1, 2020 (for some instruments from Feb, 1). Huge amount of data will freeze your terminal. Do not load too much data during one session.
The automatic data update can be turned off by pressing CTRL+BREAK. It turns on again if you remove/add indicator or change the chart timeframe.
If there is more than one ClusterDelta indicator with a graphical panel to avoid mishandling, mouse events are handled by only one indicator. To activate another indicator, just double-click on its the graphical panel.
You can use more than one #footprint on a chart, but try not to intersect their work area because the data will overlap.
If you lose the indicator control window - press F5 or X, it will fit the workspace to the current chart window.
TITLE TOOLBAR DESCRIPTION

There is an interactive menu at the top that allows you to change some parameters that will affect the content.
In the upper left corner you can see a sign like ">|", by clicking on the chart will move to the last loaded bar (you can set shift by changing the input "Shift from right edge (in bars)..."). The same if you press END on the keyboard or black arrow on white background on right-top corner.
Next, you can see dropdown list of available instruments. You can define it in the input "Futures Name..." or leave AUTO for automatic detection.

The following list is the period for displaying data. The first element is "Same as MT" means the display Orderflow chart on the same timeframe as the Metatrader use now for the current chart. The timeframe can be selected from the list; it ranges from 1 minute to 1 week including Ranges Periods..
Changing the timeframe withinh Workspace will keep all objects on the OrderFlow chart such as vertical and horizontal levels.A method for displaying data in the form of range bars has also been added, where each candle contains a predetermined height (in the number of ticks). There are 5 predefined values in the list, but you can change it in the "Range of predefined values ..." inputs. It is not recommended to use very low range values such as 1-4 because the range chart is always loaded from the beginning of the day, so this will create a lot of objects, causing the terminal to freeze.
The list next after timeframes shows the chart types. There are:
- Volume - a chart displaying volume data
- Delta - a chart showing delta data
- Ask x Bid - a chart where the ask and bid are displayed using "Volume" data color scheme
- Volume x Delta - a chart that displays volumes delta as columns in the cell with different color schemes
- Bid x Ask - for compatibility with views from others applications. the Bid x Ask type with its own color scheme has been included
- Bid x Ask / VP, Volume Profile and others. All of the are customizable in the settings.
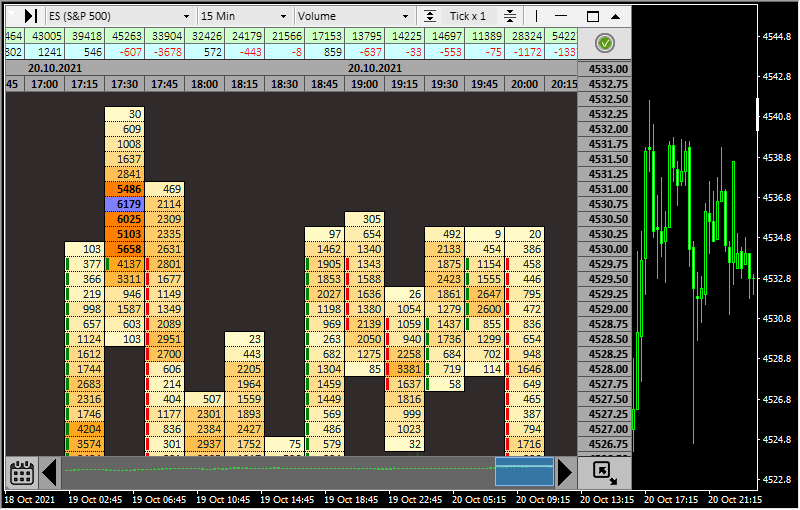
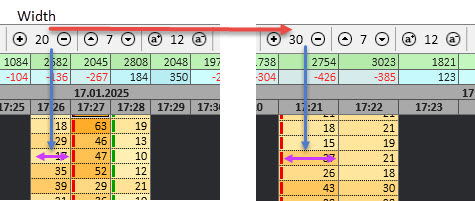
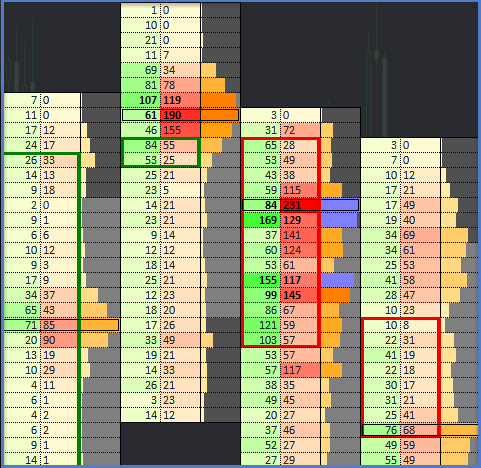
For a better understanding of high volatility markets there is a "tick multiplier" option. It is located right to the chart types. Just compare to the charts below for the same instrument/timeframe/time but with different Tick x 1 and Tick x 20 multipliers for FDAX:
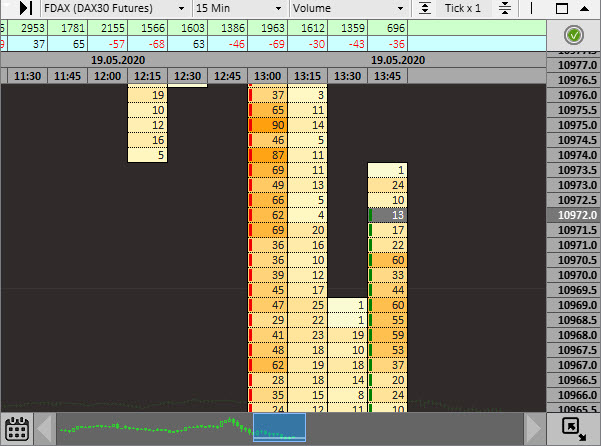
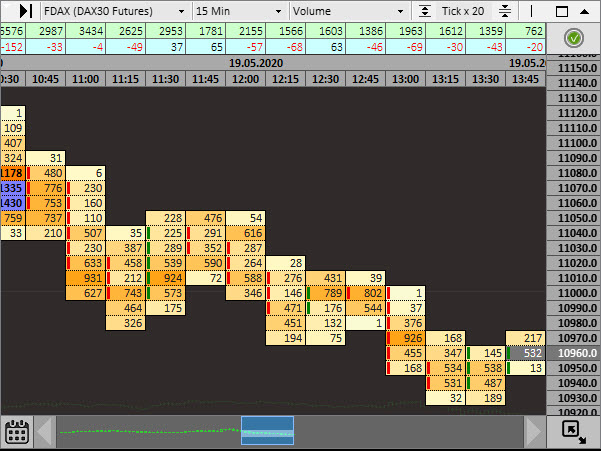
All volumes included in one step are summarized. You can find the size of the price step in the price panel. You can use "/" and "*" on the right keypad to change the tick multiplier. Predefined values can be set an the "Predefined Tick Multiplier" input.
The important button next to Tick Multiplier is "Indicators Icon". It calls additional window to manage indicators for the current chart.
The next block contains the elements "| - X", where the vertical line allows to set the vertical level on the order flow chart, the horizontal line - horizontal levels, and "Х" in active mode destroy the selected object. Horizontal levels also can be placed with Shift key pressed, Vertical by | or \ keys . When you click on an existing level, it changes colors (there are three color schemes), and then removes the level from the chart. Choosing a level while holding down the CTRL key removes it from the chart.
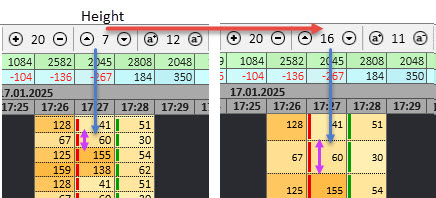
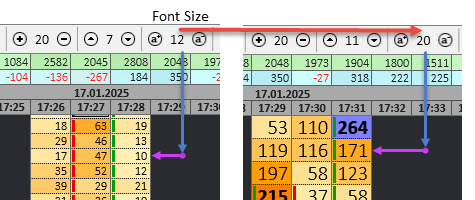
The following elements are used to resize/scale the chart.

The first block is responsible for the width of the cell (can also be changed with the [+] and [-] keys), the second block is responsible for the height of the cell, the third block is responsible for the font size of the chart, and 4th one allows you to change different fonts. If you press "Enter" on the right keypad, you can switch between predefined templates, including template by default.
The last button with the Clusterdelta logo open a window with a quick help. You can use Enter on the main pad to open it.
The last icons (rectangle and triangle) are used as the Expand/Collapse indicator window.
Please note that the F11 button opens the current MetaTrader chart in full screen mode.
At the bottom there is the navigation panel - it shows the loaded part of the chart for quick navigation. As it mentioned above the visual part of the loaded chart is displayed in the blue window. and the active are of the chart is displayed in the light box. The window can be moved horizontally and the lighting box vertically for quick navigation. The navigation panel can be adjusted in height by dragging it off the bottom edge. To navigate you can use use the keyboard: up/down/left/right arrows and PgUp, PgDn buttons, which repeat the functionaly of the right and left arrow icons on the navigation panel.
Navigation with arrows does not move the chart to the visual area. Navigation with PgUp/PgDn adjusts the chart to the price of the middle bar of the active area.
To Reactivate navigation and keys reaction in the main chart window (MT Chart), minimize the footprint window by icon in the title toolbar
Description of keyboard control:
- F5 - resize the indicator window to the default position depending on the size of the main window chart
- HOME - move the chart to the first loaded candle
- END - move the chart to the last loaded candle
- PAGE UP - move the chart back screen back
- PAGE DN - move the chart forward one screen
- ARROW LEFT - move the chart back two candles
- ARROW RIGHT - move the chart two candles forward
- ARROW UP - move up 4 price step
- ARROW DOWN - move down 4 price step
- TAB - move forward for a certain period depending on the current timeframe (4 hours, 8 hours, 1 day)
- SPACE - adjust the chart position to the close price of the middle bar
- SHIFT/CTRL - manage objects on the chart
- Keys on the right keypad
- [-] - decrease the width of candle
- [+] - increase the width of candle
- [/] - decrease the tick multiplier
- [*] - increase the tick multiplier
- Enter - switch between predefined templates
- F11 - switch to fullscreen mode (native MT functionality)
INDICATORS WINDOW
Indicator window allows you to manage indicators and change their options without reloading data and apply their new values to the chart. Changing options in the MT inputs is restarting indicator. Keep in mind that ClusterDelta_#Footprint is a MetaTrader indicator written on MQL and it is not a complete application. It means Indicator window dialog is not a native Winapi window.
ClusterDelta_#Footprint for MetaTrader has next indicators:
- Header Indicators (in the settings it has a prefix Summary) - the indicators on the top of the workspace with summary data for Volume/Delta/Cumdelta/Min Max Delta and Date/Time panel. You can just switch is indicator have to be active or not active on the chart.
- Imbalance indicator to find abnormal ratio in the ask:bid pair. In the settings there is an option to activate Alternative Imbalance indicator but there are no interactive dialog. Current Imbalance interface allows you to switch between Imbalance Types (input option "Imbalance Type") , Calculation Mode (input option "Imbalance Calculation Mode"), change the Strike values that filters values by its size (input option "Imbalance Major Lowest Value") and Imbalance Ratio for calculation (input option "Imbalance Ratio").
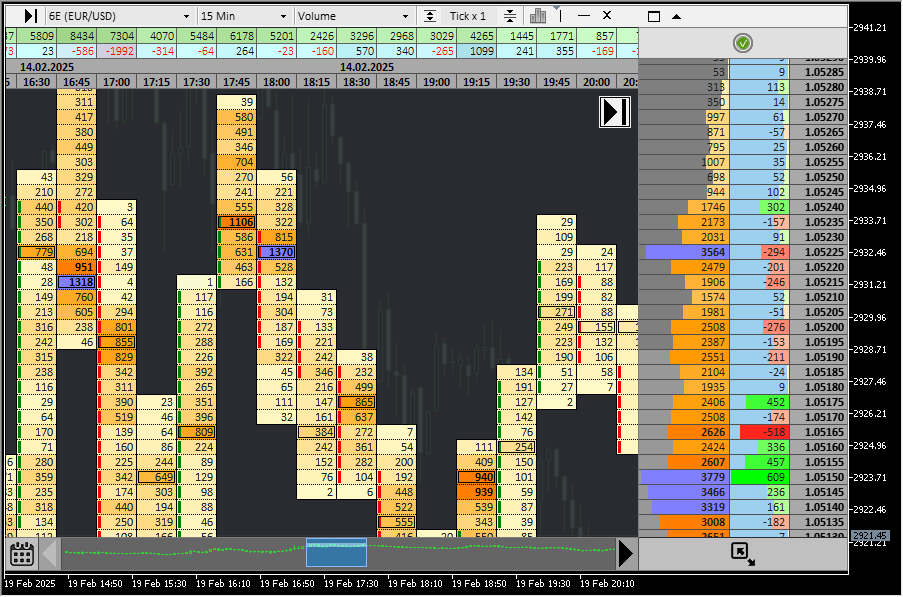
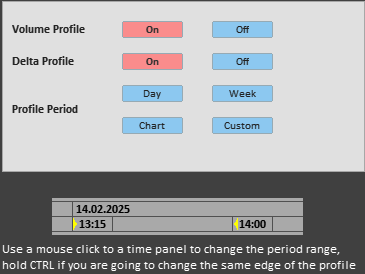
- Market Profile shows the summary for volume or delta by prices on the right side of the chart. Interface allows to activate/deactivate Volume or Delta Profile and change predefined period such as "Day", "Week", "Chart", "Custom". "Day" period is a full day session since start of market working hours. "Week" period starts after weekend break (the data must to be loaded to fit the period). "Chart" calculates the profile using current loaded data and "Custom" is a intraday time period defined in the settings. Use left mouse button on the time panel to change period to any that you would like to see. Depends on your click position and current triangle marks, indicator changes the start or finish time. To change the same parameter again, just hold the CTRL key. The marketprofile tip on the image below indicators that the volume/delta profile start on Feb, 14 13:15 and finish right before Feb, 14, 14:00 but they do not include a data of the 14:00 bar.
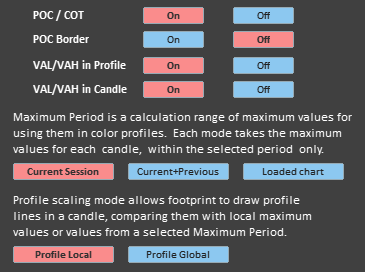
- Chart Settings has few options:
- POC / COT - activates the POC indicator on the chart
- POC Border - use double border for the POC indicator
- VAL/VAH in Profile - activates Value Area in a Volume Profile indicator that use different background (input option MarketProfileVABackground)
- VAL/VAH in Candle - activates Value Area in each candle by indicating VAL/VAH prices by a specified line (input option ValueArea_Color)
Maximum Period (input option "Maximum Calculation Period") lets you choose which data periods are used to calculate the max values for a current session that applies to the color scheme of the chart as it depends from the absolute maximum.
- Current Session value means that the data used to calculate the maximum values of the current session is the only data available since the start of the current trading session (the exchanges trading session starts right after daily or weekend trading break time)
- Current+Previous value means that the data used to calculate the maximum values of the current session is the data available since the previous trading day
- Loaded chart uses the all loaded data for a current chart
Profile Scaling mode (input option has the same name) lets you choose which high value will be used to scale profile in the bar.
- Profile Local sets the max scaling value as max value of the current bar (the maximum width of profile at the position of the maximum value in the bar has to fit all cell width)
- Profile Global uses the max value to scale the profile based on the max values calculated using the Max Values Calculation Period option. This option scales the width of the profile, synchronizing it with values in other bars.
INPUTS DESCRIPTION
Common settings
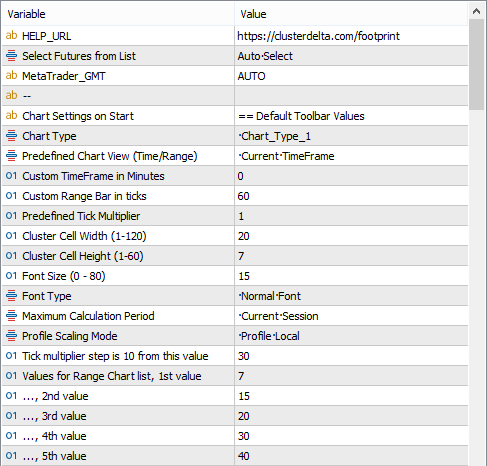
HELP_URL - this is the URL where you can get the full description of the indicator.
Select Futures from List - select a futures from the dropdown list as the source for data. Value Auto Select causes automatic detection of the instrument by the MT ticker.
MetaTrader_GMT - the GMT value of your Metatrader. In 95% of cases leave AUTO.
Chart Type - the type of chart like Volume / Delta / Bid x Ask, that will be used on default. Chart_Type_n options are located in the bottom of the inputs (and described in the bottom of this page)
Predefined Chart View (Time/Range) - select a chart mode from the list: Current Timeframe, Custom TimeFrame or Custom Range
Custom TimeFrame in Minutes - if you selected a Custom Timeframe mode, you must specify the timeframe period in minutes.
Custom Range Bar in ticks - if you selected a Custom Range mode, you must specify the size of the bar in ticks .
Predefined Tick Multiplier - set Tick Multiplier value for the price. For a high volatility chart, it is a good idea to shrink the chart to see the merged data through the more useful view.
Cluster Cell Width - the width of the candle cell in range from 1 to 120. The default value is 20.
Cluster Cell Height - the cell height from 1 to 60.
Font Size - the font size from 1 to 80, or 0 so that the text is not displated.
Font Type - there are 4 fonts having small difference that you may like.
Maximum Calculation Period - lets you choose which data periods are used to calculate the max values for a current session that applies to the color scheme of the chart as it depends from the absolute maximum value ("Current Session" value means that the data used to calculate the maximum values of the current session is the only data available since the start of the current trading session, "Current+Previous" value means that the data used to calculate the maximum values of the current session is the data available since the previous trading day, "Loaded chart" uses the all loaded data for a current chart)
Profile Scaling Mode lets you choose which high value will be used to scale profile in the bar. ("Profile Local" sets the max scaling value as max value of the current bar, "Profile Global"uses the max value to scale the profile based on the max values calculated using the Max Values Calculation Period option. This option scales the width of the profile, synchronizing it with values in other bars.)
Tick multiplier step is 10 from this value.When the tick multiplier reaches this value, the step will be equal to 10 (when increasing from the lower value to the upper value) or will be equal to 1 if the tick multiplier decreases and becomes lower than this value.
There are 5 predefined values for the range charts in the interactive menu. You can set their value in the inputs below.
Value for Range Chart list, 1st value - the first row of the default values of the range chart list
..., 2nd value, ..., 3rd value, ..., 4th value, ..., 5th value - 2nd, 3rd, 4th and 5th elements of the range chart list.
Coefficents / Chart Options
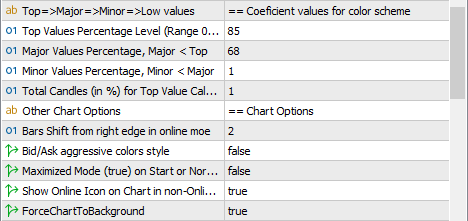
Top Values Percentage Level - the percent of the maximum value to define high volumes. If the value exceeds this top percentage of the maximum value, it will be called "top level".
Major Values Percentage - the percent of the maximum value for determining the valuable volumes (less than Top). If the volume is greater than this percentage of maximum volume and less than Top level, the color scheme "above major" will be used.
Minor Values Percentage - the percent value for determining the common volumes (should be less than Major). If the volume is greater than this percentage of the maximum value and less than the Major level, the color scheme "minor<->major" will be used. All volumes below than Minor level are displayed using the Low Volumes color scheme .
Total Candles (in %) for Top Value Calculation - how many candles with the maximum volumes of the total value of the candles will be used to determine the maximum value as the average of maximum values of these candles. Very high spikes of volumes should be avoided as they can affect the overall appearance of the order flow chart.
Bar Shift from right edge in online mode. When the “Online Chart” mode is activated, the indicator follows the last price and if a bar (current or new bar) with last price is closer to the right edge than the number of bars defined by this value, the indicator will shift the chart to the left, leaving an empty space for easy reading of the data.
Bid/Ask aggressive colors style uses the maximum delta value instead of the maximum Ask or Bid value to apply it to the background color calculation. Since the maximum delta is almost always less than the maximum Ask/Bid, this substitution results in a more aggressive color scheme at lower Ask/Bid values.
Maximized Mode on Start - an option that allows to expand the footprint window to the maximum windows size at startup
Show Online Icon on Chart in non-Online mode displays the button (Black Arrow on white background in the right top corner of the chart workspace) when the chart us in a static mode (the indicator does not follow the changes of the current price). The button can be turned off by this option, and the Online mode can be activated only by pressing the "End" key.
ForceChartToBackground - switches the MetaTrader variable "Chart to Foreground" to the false value to not override the footprint chart.
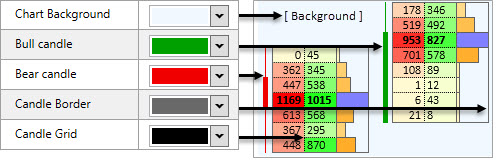
Chart Colors
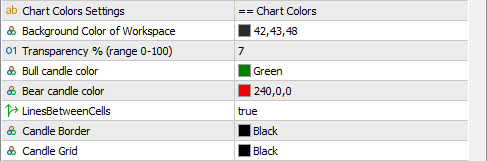
Background Color of Workspace - workspace background behind an orderflow chart
Transparency % - workspace background transparency to see the spot chart behind the Footprint indicator. 0 [ no transparency ] - 100 [ full transparency ].
Bull candle color - font color of borders or signs that demonstrate the body of the bull candle
Bear candle Color - font color of borders or signs that demonstrate the body of the bear candle
LinesBetweenCells is the option to draw separator lines for each cell in the orderflow bar
Candle Border - the color used by the border lines around the orderflow bar
Candle Grid - the color used by the separator lines between cells in the orderflow bar
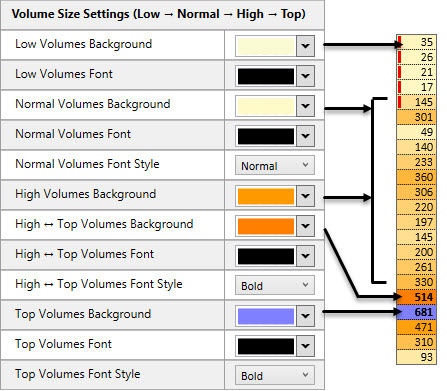
Description of colors (screen from the ClusterDelta Orderflow App settings description)
Color Scheme for Volumes values (Low → Normal → High → Top )

Low Volumes Background is the background for the values that are lower than Minor level (see Common Settings, Minor Value, Major Value, Top Value).
Low Volumes Font is the font color for Minor values.
Normal Volumes Background is the start color of the gradient background for the values that are between Minor and Major level.
Normal Volumes Font is the font color for Normal values.
Normal Volumes Font Style is the font style (Bold/Normal) for Normal Volumes, where true means Bold style
High Volumes Background is the end color of the gradient background for the values that are between the Minor and Major levels.
High → Top Volumes Background is the static background color for the High values that are higher than the Major level but lower than the Top level.
High → Top Volumes Font is the font color for the High values .
High → Top Volumes Font Style is the font style (Bold/Normal) for High → Top values, where true means Bold style
Top Volumes Background is the background color for the Top values that are higher than Top level.
Top Volumes Font is the font color for the Top values .
Top Volumes Font Style is the font style (Bold/Normal) for Top Volumes values, where true means Bold style
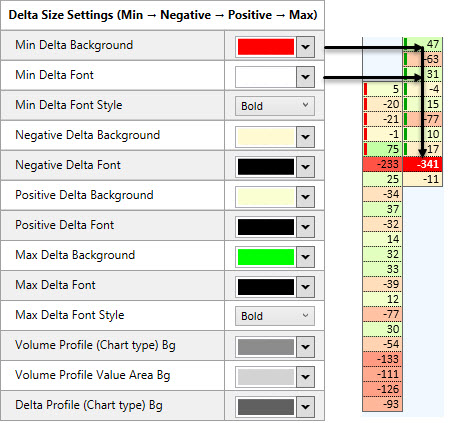
Description of colors (screen from the ClusterDelta Orderflow App settings description)
Color Scheme for Delta values (Min ← Negative ← 0 → Positive → Max)
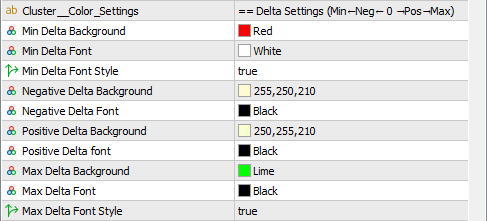
Min Delta Background is the background for the Delta Negative values that are higher (in absolute value) than the Top Delta value, which is calculated using the same logic as the Top Volume value. This color also used as the end color of the gradient background for Normal Negative Values together with Negative Delta Background color as the start color.
Min Delta Font is the font color for Top Delta Negative values.
Min Delta Font Style is the font style (Bold/Normal) for Top Delta Negative values, where true means Bold style
Negative Delta Background is the start color of the gradient background for the Normal Delta Negative values that are between 0 and Top Delta with negative sign.
Negative Delta Font is the font color for Normal Negative values.
Positive Delta Background is the start color of the gradient background for the Normal Delta Positive values that are between 0 and Top Delta with positive sign.
Positive Delta Font is the font color for Normal Positive values.
Max Delta Background s the background for the Delta Positive values that are higher than the Top Delta value. This color also used as the end color of the gradient background for Normal Positive Values together with Positive Delta Background color as the start color.
Max Delta Font is the font color for Top Delta Positive values.
Max Delta Font Style is the font style (Bold/Normal) for Top Delta Positive values
Description of colors (screen from the ClusterDelta Orderflow App settings description)
Color Scheme for Summary Indicators
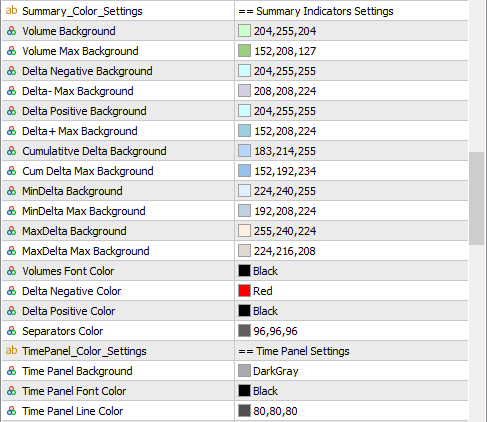
Volumes Background is the start color for the gradient to define the target color depending on the Summary Volume Value.
Volumes Max Background is the end color for the Summary Volume gradient, associated with the maximum Summary Volume value.
Delta Negative Bg is the start color for the gradient to define the target color depending on the Summary Negative Delta Value.
Delta- Max Background is the end color for the Negative Delta gradient, associated with the maximum absolute Summary Delta value.
Delta Positive Bg is the start color for the gradient to define the target color depending on the Summary Positive Delta Value.
Delta+ Max Background is the end color for the Positive Delta gradient, associated with the maximum absolute Summary Delta value.
Cumulative Delta Background is the middle(!) color for the gradient to define the target color depending on the value of Cumulative Delta using its lowest and highest value.
Cum Delta Max Background is the start and end color for the Cumulative Delta gradient, associated with the lowest and highest value of Cumulative Delta value.
MinDelta Negative Bg is the start color for the gradient to define the target color depending on the MinDelta Value.
MinDelta Max Background is the end color for the MinDelta gradient, associated with the maximum absolute MinDelta value.
MaxDelta Negative Bg is the start color for the gradient to define the target color depending on the MaxDelta Value.
MaxDelta Max Background is the end color for the MaxDelta gradient, associated with the maximum absolute MaxDelta value.
Volumes Font Color is the font color used for the Volumes indicators.
Delta Negative Color is the font color used for negative Delta values of Delta dependent indicators.
Delta Positive Color is the font color used for positive Delta values of Delta dependent indicators.
Separators is the color of lines between indicators cells.
Time Panel Background is the background color for Date and Time panel
Time Panel Font Color is the font color for Date and Time
Time Panel Line Color is the color of the separating lines
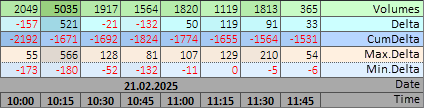
Example of colors
Color Scheme for Price/Navigation Panels
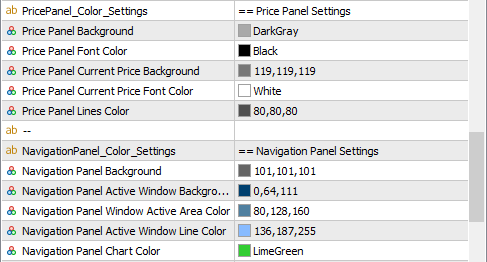
Price Panel Background is the background color for the price panel
Price Panel Font Color is the font color for the prices
Price Panel Current Price Background is the background color for the current price
Price Panel Current Price Font Color is the font color for the current price
Price Panel Lines Color is the color of the lines separating prices
Navigation Panel Background is the background color of navigation toolbar panel
Navigation Panel Active Window Background is the background color of the active window of the navigational panel
Navigation Panel Window Active Area Color is the background color of the active area in the active window
Navigation Panel Window Active Line Color is the border color of the active area
Navigation Panel Chart Color is the chart color in the navigational panel
Lines Colors
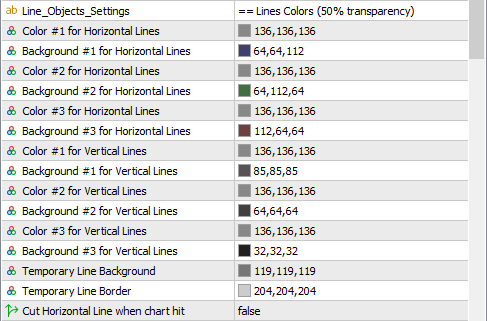
For each type of the custom lines that user may put to the chart, there are 3 colors that changes themselves on each next attempt to put the line on the same position. Next attempt removes the line. These settings defines the Border and Background colors for the Horizontal and Vertical Lines.
Temporary Line Background is the background of temporary line before placing line to its static position.
Temporary Line Border is the border of temporary line before placing line to its static position.
Cut Horizontal Line when chart hit is an option that allows you to change the default behavior of the line, which draws a line to the end of the workspace. The line will be cut off when it meets the chart bar.
Example of the line colors
Miscellaneous Settings

Bg for Volume Profile in bar is the background of the cell if the type of the cell is "Volume Profile"
Bg for Delta Profile in bar is the background of the cell if the type of the cell is "Delta Profile" or "Ask/Bid Profile"
Show Value Area in Volume/Delta Profile determines whether to use the value area background in cells within the value area
Bg for Value Area in Volume Profile is the background of the cell if the type of the cell is "Volume Profile"
Bg for Value Area in Delta Profile is the background of the cell if the type of the cell is "Delta Profile" or "Ask/Bid Profile"
Data from the markets comes as is, i.e. the 6S futures is the CHF/USD pair. If you want to see the data in the usual reverse mode, switch the necessary options below to “true”.
ReversePait_6C_to_USDCAD is to show data appropriate for USD/CAD pair
ReversePait_6J_to_USDJPY is to show data appropriate for USD/JPY pair
ReversePait_6M_to_USDMXN is to show data appropriate for USD/MXN pair
ReversePait_6S_to_USDCHF is to show data appropriate for USD/CHF pair
POINT OF CONTROL
POC ("Point of Control") indicator shows the price where the highest volume of trades occurred within a time period represented by one bar.
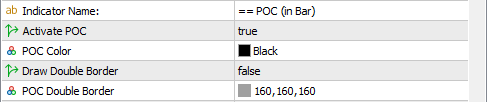
Activate POC turns on the POC indicator on the chart.
POC Color is a color of the lines used by POC rectangle.
Draw Double Border - option to make the POC rectangle more visible.
POC Double Border is a color of the borders used by POC rectangle with active double border option.
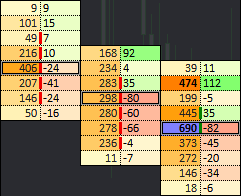
The POC Example on the Volume x Delta chart
VALUE AREA
Value Area indicator shows the prices representing Value Area High (VAH) and Value Area Low (VAL). The value area is the area within the bar where a significant part of total volumes were traded.
Activate Value Area turns on the Value Area indicator on the chart.
Percentage of Value Area determines what amount of the total volumes represents the Value Area.
Value Area Lines color is a color of the lines used by Value Area Lines

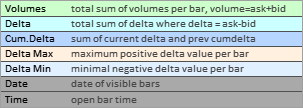
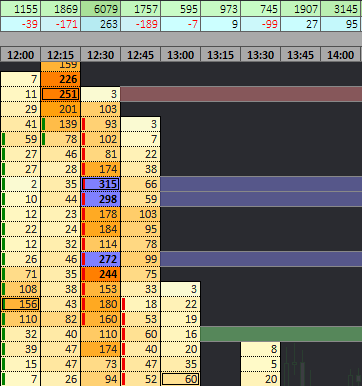
SUMMARY INDICATORS
Summary Indicators show summary information for a bar such as the sum of total traded volumes, delta and their modifications.
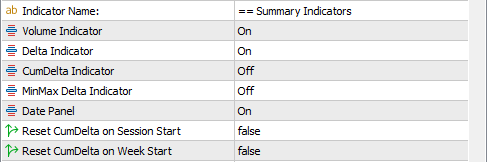
Volume Indicator turns on the Volume indicator panel.
Delta Indicator turns on the Delta indicator panel.
CumDelta Indicator turns on the CumDelta indicator panel.
MinMax Delta Indicator turns on the MinMax Delta indicator panel.
Date Panel display the current date of visible bars.
Reset CumDelta on Session Start set the CumDelta value equal to zero at the start of the each new trading session.
Reset CumDelta on Week Start set the CumDelta value equal to zero at the start of the each new week..
The colors of the indicators are describe in "Color Scheme for Summary Indicators" section.
MARKET PROFILE
Market Profile shows summary information for traded volumes (Volume Profile) and delta (Delta Profile) by prices in time.
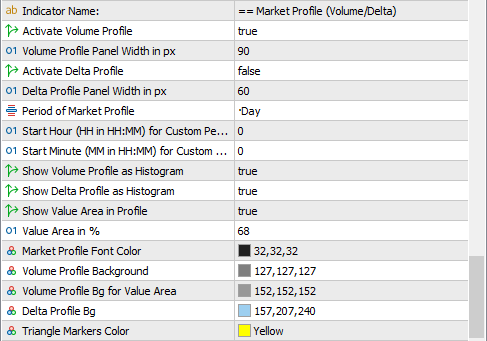
Activate Volume Profile turns on the Volume Profile panel.
Volume Profile Panel Width in px is the absolute width of the panel in the workspace in pixels.
Activate Delta Profile turns on the Delta Profile panel.
Delta Profile Panel Width in px is the absolute width of the panel in the workspace in pixels.
Period of Market Profile sets the time period to calculate profile values.
- Day - from the start of Globex trading until the break, 00:00-23:59 GMT+2
- Week - from the start of Globex trading on Monday (GMT+2) until break on Saturday. The full week chart must be loaded before.
- Chart - the whole loaded chart in the current indicator
- Custom - the period starting from custom time until end of trading session.
- UserInteractive is an option that does not change the start/finish times and is technically required for time periods set interactively by the user by clicking on the time panel.
Start Hour (HH in HH:MM) for Custom Period is a start hour in the Custom Time when "Period of Market Profile" is "Custom".
Start Minute (HH in HH:MM) for Custom Period is a start minute in the Custom Time when "Period of Market Profile" is "Custom".
Show Volume Profile as Histogram is an option that toggles between histogram mode and normal mode, where the entire cell (not a partial as in histogram mode) will be filled with the desired color.
Show Delta Profile as Histogram is an option that toggles between histogram mode and normal mode, where the entire cell (not a partial as in histogram mode) will be filled with the desired color.
Show Value Area in Profile calculates Value Area and fill the cells inside Value Area by a different color defined in the "Volume Profile Bg for Value Area" option
Value Area in % is the percentage of the number of total volumes that represent the Value Area.
Market Profile Font Color is the font color of values of volume/delta profile.
Volume Profile Background is the default cells background in the Volume Profile panel.
Volume Profile Bg for Value Area is the background of the cells inside Value Area in the Volume Profile panel.
Delta Profile Bg is the cells background in the Delta Profile panel.
Triangle Marker Color is the color of the triangular markers that define the start and end times of the profile in the “Time” panel.
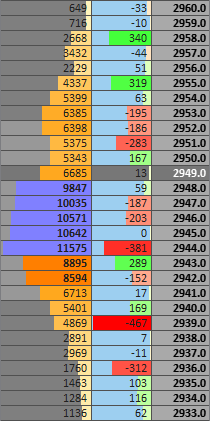
The example of volume and delta profiles.
IMBALANCE INDICATOR
Imbalance is designed to display the trade imbalances in the trading process, such as the significant ratio of buyers and sellers on the same price.
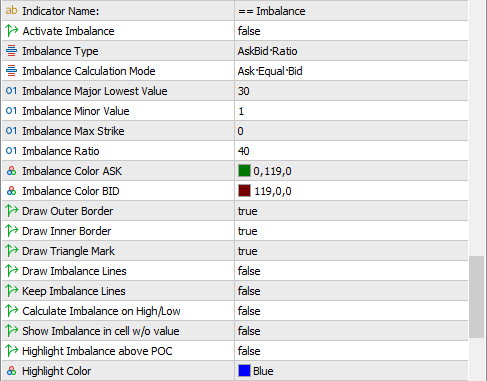
Activate Imbalance turns on the Imbalance indicator.
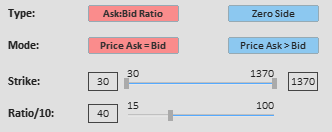
Imbalance Type sets the type of Imbalance calculation.
- Ask:Bid Ratio search for non-zero values of Ask and Bid and their ratio (ratio calculates in both way, Ask:Bid and Bid:Ask)
- Zero Side search for Ask:Bid pair where one of the value is zero.
Imbalance Calculation Mode sets the price mode of Imbalance calculation.
- Ask Equal Bid searches for Ask:Bid imbalance, where the Ask and Bid prices are equal.
- Ask Above Bid searches for Ask:Bid imbalance, where the Ask price is above the Bid price
Imbalance Major Lowest Value is the minimum value of the major part of the ask:bid imbalance pair (on pair with value 60:15, 60 is the major value and 15 is the minor value).
Imbalance Minor Value - the minimum value of the minor part of the ask:bid imbalance pair. The minimum value is 0. When the Minor Value is zero, the mode "Zero Side" automatically will be activated to the "Ask:Bid Ratio" mode.
Imbalance Max Strike is the maximum value value of the major part of the ask:bid imbalance pair. The "0" values mean all available values greater than the Imbalance Major Lowest Value
Imbalance Ratio is the Ratio in Ask:Bid pair multiplied by 10. The default range is 1.5 - 10.0 but due to technical issues it was required to use decimals only value. The value "40" means 4:1 (40:10). So right now the available range is 15-100 (instead of 1.5 - 10.0). If you find that your version already uses ratios 1.5 - 10.0 instead of the range 15-100, it means that this issue was fixed and you need to use corrected range.
Imbalance Color ASK is the color of Imbalance where the Ask value is the major (greater than Bid) value of the Ask:Bid imbalance pair.
Imbalance Color BID is the color of Imbalance where the Bid value is the major value of the Ask:Bid imbalance pair.
Draw Outer Border is the part of visualization of the imbalance object together with Inner Border and Triangle Marks.
Draw Inner Border is the rectangle inside cell on the major cell value or all cells depends on Chart Type.
Draw Triangle Mark is the triangles that shows direction of the minor value and it depends on Imbalance Calculation Mode and positions of Ask and Bid cells.
Draw Imbalance Lines are the lines to the end of the workspace if the imbalance just appeared on the last bar (applies only to new imbalances).
Keep Imbalance Lines is an option that allows you to keep on chart or remove imbalance lines when the last bar has just closed and a new one has already opened.
Calculate Imbalance on High/Low is not used in imbalance trading theory. You can change this option to see imbalance on High/Low as well.
Highlight Imbalance above POC uses different Highlight color if Imbalance found on the POC price and the POC indicator is active.
Highlight Color is the color when the imbalance and POC have the same price and the Highlight option above is enabled..
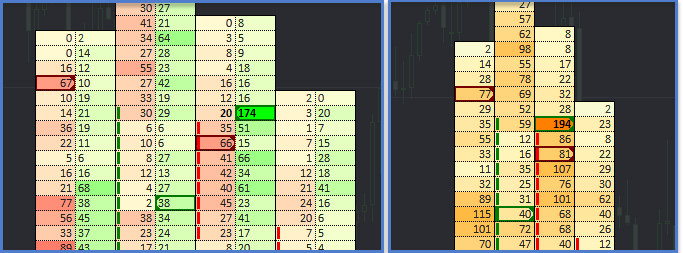
The example of Imbalance on the same chart in Volume and Bid x Ask modes.
ALTERNATIVE IMBALANCE INDICATOR
Alternative Imbalance is intended to display imbalances with a higher ratio along with normal imbalances. The Ratio of an Alternative Imbalance must be greater than the Ratio of a Normal Imbalance, so Alt.Imbalance overrides Normal Imbalance Objects.
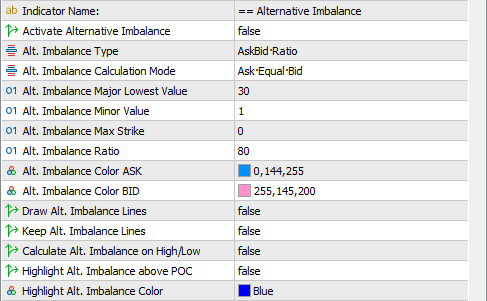
Activate Imbalance turns on the Alternative Imbalance indicator. It is required that Normal Imbalance indicator must be enabled too.
The remaining options and descriptions of the Alternative Imbalance options are the same as the Normal Imbalance options described above. Some missing options in Alternative panel are taken from the Imbalance settings.
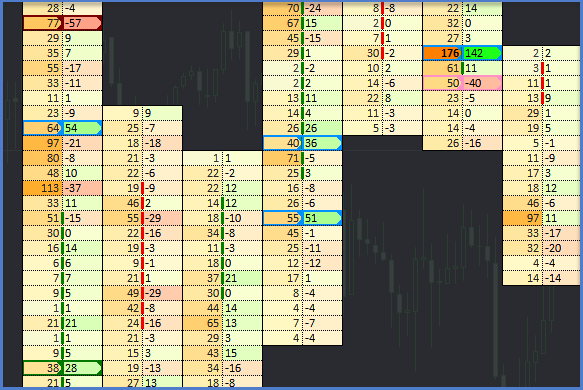
The example of Alternative Imbalance together with Normal Imbalances.
UNFINISHED AUCTION INDICATOR
Unfinished Auction is a market situation at the high or low of a bar, when, for example, at the high of the bar the Ask price moves up, but there are no trades at the Ask price, at the same moment the Bid price becomes equal to the High bar price and trades take place at it. Thus, at the High price we can see both Ask and Bid orders. Finished auction of High price is the normal mode, where there are Ask orders and no Bid orders (Ask : 0). For the Low Bar price the situation is the same, but in reverse.
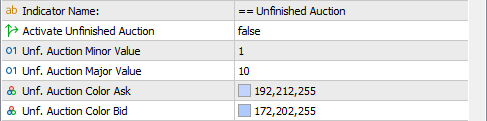
Activate Unfinished Auction turns on the Unfinished Auction indicator.
Unf Auction Minor Value is the minimum minor value of the Ask:Bid pair.
Unf Auction Major Value is the minimum major value of the Ask:Bid pair.
Unf Auction Color Ask is the color of the Unfinished Auctions on the High price of the Bar.
Unf Auction Color Bid iis the color of the Unfinished Auctions on the Low price of the Bar.
The example of Unfinished Auction.
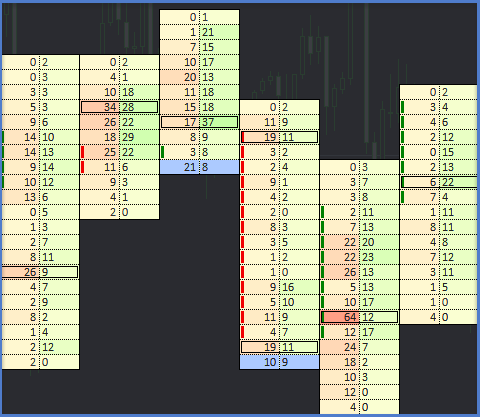
CHART BUILDER
Chart Type is the definition of types using format. The user can change the types for his own purposes.
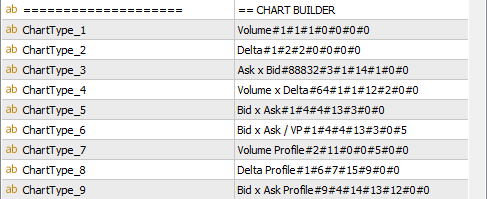
Chart Type_n - is the string for chart type defined by chart builder format. Change the value of the type to apply the new settings in the Chart Type drop down menu in the Title toolbar.
Description of Char Type is the short description for MetaTrader user on how to use Chart Builder.
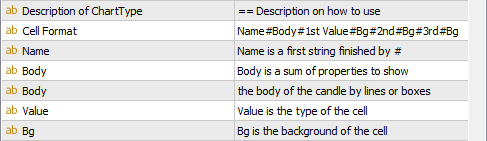
Chart Type string has strict format: Name#Body#1st Cell Value#Bg of 1st Cell#2nd Value#2nd Bg#3rd Value#3rd Bg
- Name is just a text description of the chart type
- Body is a value to draw the body of the candle. It would be presented by small rectangles on the left or right side of the cell or it can be the lines around the cells. So the candle can be divided up to 3 cells. Each cell has two positions of small rectangle (left and right) and 4 possible lines - Left, Top, Right, Bottom. If you want to use border around 1st and 2nd cell , it is required Left #1, Top #1, Top #2, Right #2, Bottom #1, Bottom #2 lines to make the body. So you just need to find the values of these lines and find the total sum of these values.
- 1st Cell Value is a value in the cell represented by Volume , Delta (any, positive or negative), Bid or Ask values and their alignment inside the cell
- 1st Cell Bg is a value of the background represented by Volume color scheme, Delta colors scheme, Bid / Ask schemes or Volume/Delta/Bid/Ask profiles.
- 2nd Cell Value is a value in the 2nd cell. Use 0 if you do not need the value
- 2nd Cell Bg is a value of the background in the 2nd cell. Use 0 with cell value 0 if you do not need to draw this cell
- 3nd Cell Value is a value in the 3rd cell.
- 3nd Cell Bg is a value of the background in the 3rd cell
Available values for Body. The required values must be summarized.
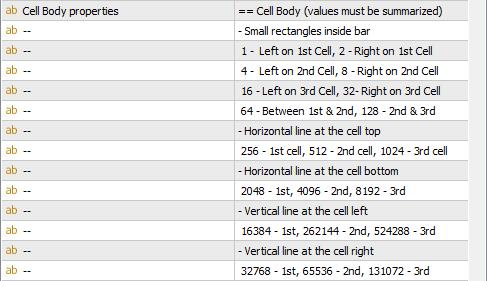
Our example above (Left #1, Top #1, Top #2, Right #2, Bottom #1, Bottom #2) is the values Left #1 = 16384, Top #1 = 256, Top #2 = 512, Right #2 = 65536, Bottom #1 = 2048, Bottom #2 = 4096, so the total sum for our result value us 16384+256+512+65536+2046+4096 = 88832
Available values for Cell. Only one required value should be selected.
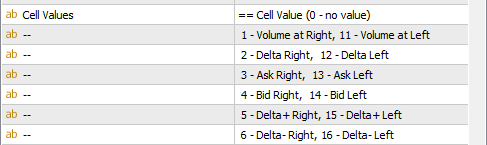
Let's say that we want to get a chart Ask x Bid x Volume Profile with body on 1st and 2nd cell. So we will need the values: Ask on Right =3 for the 1st cell, Bid on Left = 14 for the 2nd cell, and 0 value for the 3rd cell
Available values for Background Color. Only one required value should be selected.
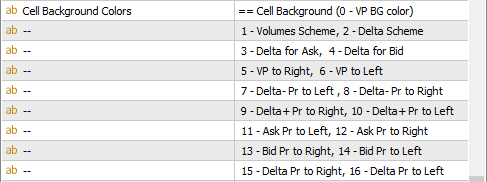
For our chart Ask x Bid x Volume Profile we will need Bg: Ask Scheme = 3 for the 1st cell, Bid Scheme = 4 for the 2nd cell, and Volume Profile to Right that is 5.
The Final Chart Type Value is Ask x Bid x Volume Pr#88832#3#3#14#4#0#5. Let's see how it looks
MOUSE WHEEL
MetaTrader 5 allows you to use Mouse wheel so it can be used for Zoom of the Orderflow chart.
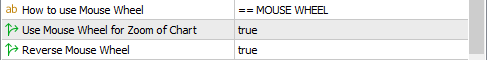
Use Mouse Wheel for Zoom of Chart is the option that allows use Mouse Wheel for Zoom changing.
Reverse Mouse Wheel is the option that changes direction of zoom on mouse wheel event.
ERRORS ON START
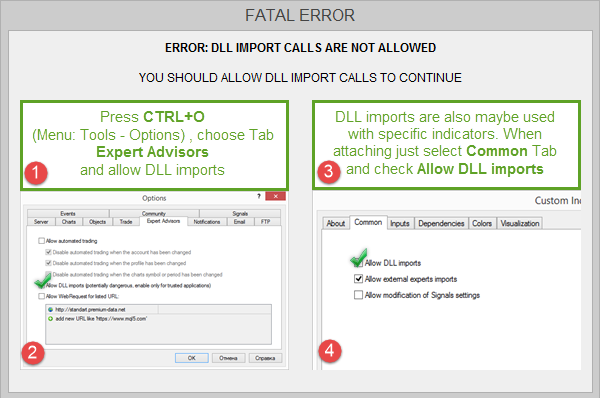
This error signal that your MetaTrader does not allow "DLL import" from indicators. To resolve the issue, press CTRL+O (or go to the Options menu), selecte Experts Advisers tab, and select the "Allow DLL Imports" option. You can also do this every time you add an indicator to the chart by selecting this option in the Common tab of the indicator.
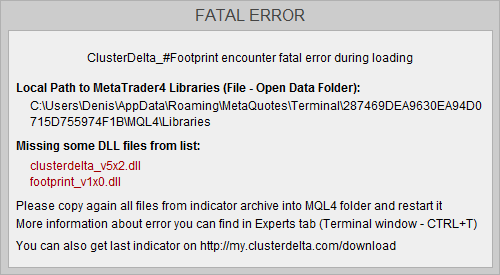
This window shows that indicator can not find required DLL files. You must copy all files from the archive you downloaded. Open Metatrader, Menu "File" -> "Open Folder Data". In a new window go into the MQL4 folder and copy everything from the archive here. Then you need to remove and add indicator again. And just inform you that you can remove this window from the list of objects (CTRL+B)
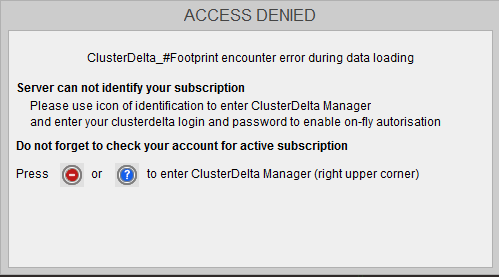
This error indicates that you do not have an access to the indicator data on the server. This is usually because you are not authorized or you do not have the subscription. Use the built-in authorizer in the Clusterdelta manager (upper right corner), enter your credentials (clusterdelta login and password) and refresh the current status.

