
")
- Header Indicators
- Imbalance
- Market Profile
- Alternative Imbalance
- Unfinished Auctions
- Footer Indicators
- Point of Control (POC)
- Value Area and VAL/VAH in the Bar
- Indicators Chart Area
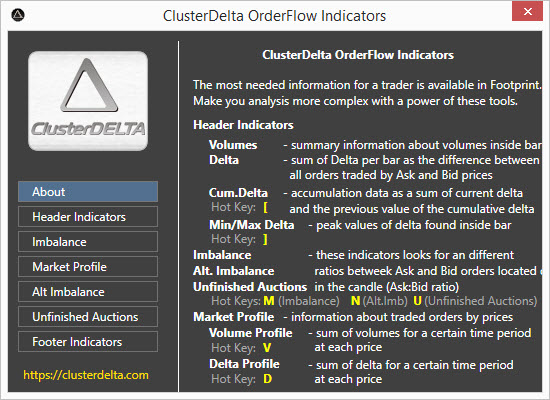
Indicators are the part of the chart that shows data in a different layer (like Volume Profile) or shows the current situation that is not regular on the chart (like Imbalance)
Hot keys for activate/deactivate indicators:
- M - Imbalance On/Off
- N - Alternative Imbalance On/Off
- U - Unfinished Auctions On/Off
- V - Volume Profile On/Off
- D - Delta Profile On/Off
- [ - Cum Delta on HeaderOn/Off
- ] - Min/Max Delta on Header On/Off
1. Header Indicators
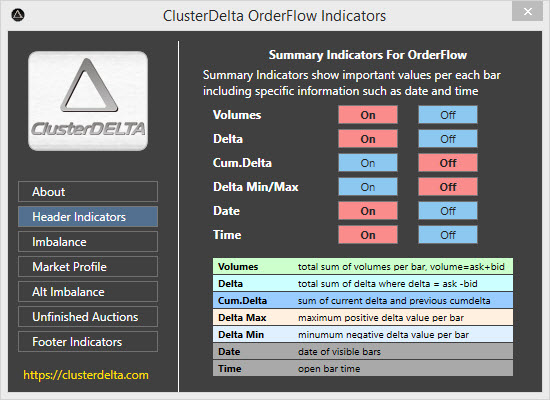
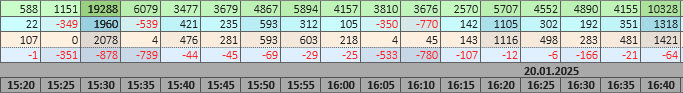
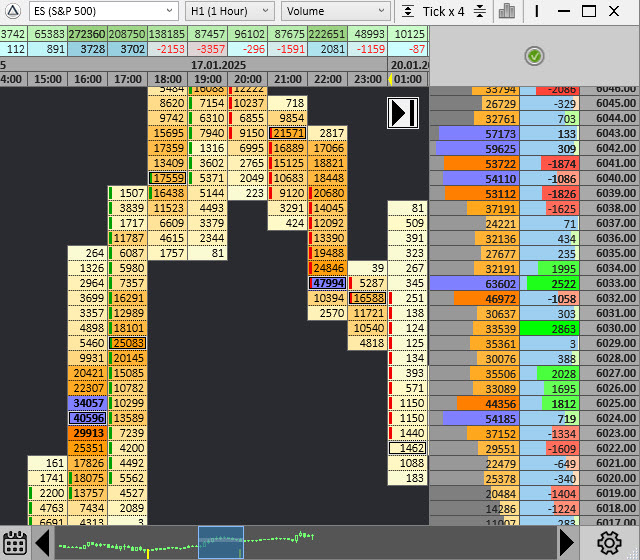
The top area of the workspace is used by Header Summary Indicators, and you can access the full list of these indicators in the Indicators window under "Header Indicators". This list includes Volume, Delta, Cumulative Delta, Min/Max Delta, and even Date and Open Time for the bar. Dragging by Indicator area allows to move application window among desktop and clicking to a Header Time panel switches the Start/End period of Volume/Delta Profile.
The data comes from the markets are the volumes that have been traded at the ask or bid price, so each tick has an ask volume or a bid volume. Total volume per bar is the sum of the ask and bid volumes during the time of bar formation, and you can see this value on the Volumes indicator. The difference between the ask and bid volumes is called the Delta. You can summarize these values using the current delta value and the previous cumulative value (delta of 1st bar + delta of 2nd bar + and so on with delta of each bar until current), which is called the Cumulative Delta. The fluctuations within a bar during the timeframe period cause peak values, which are fixed as Maximum and Minimum Delta per bar, also known as Min/Max Delta. The date and time are shown using the GMT option from the settings ("Auto" value uses local time GMT).
Each indicator has two colors for its background: a start color for the minimum value and a max color for the maximum absolute values (negative values are converted to their absolute values). The values between the start and max colors are averaged using RGB color components. The indicator that has positive and negative values has different settings for the positive and negative color shadings. It's recommended to set the start color to the same value to have soft shading. The font colors are separated too, depending on whether the value is positive or negative. You can change the colors at Settings -> Summary Indicators
The Font Size and Height of the Cell can be changed in the Settings by chaging the option "Summary Cell Height", "Min Font Size for Summary Info" and "Max Font Size for Summary Info". The Font size is calculated using the last two options and the available width and height of the cell to fit the value in.
3. Market Profile
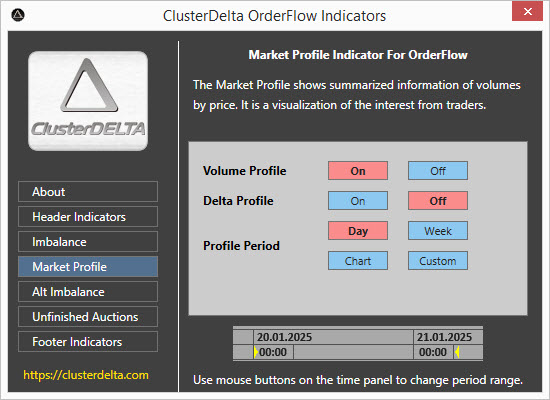
The Volume Profile shows data based on the time range, like a summarized value of volumes on the same price levels for the time period you set. The Delta Profile uses Delta values to make calculations. There are four profile periods, plus dynamic, which you can define using a time panel. The Day period is from the start of the trading session for the next 24 hours. The Week period is from the start of the trading session in the beginning of the week, lasting 24 hours a day, seven days a week. If you select the "Week" period, though, no data will load, so you might see a warning that the loaded data isn't complete. This means you can't calculate the full week period. The Chart will calculate the profile for the whole period that's loaded in the platform chart. You can use the Custom option to change the start time to a different time than the start of the session for the next 24 hours. The custom time settings are the part of Settings -> Market Profile. There's a small window below with the date and time, and yellow marks show the current start/end period time for profile calculations.
If the option Mark Value Area in Market Profile at Settings -> Common Settings is set to True, indicator (using Value Area Percentage value) calculates Value Area zone and display the background of the Value Area by the different color defined at Settings -> Chart Colors with Volume Profile Value Area Bg option.
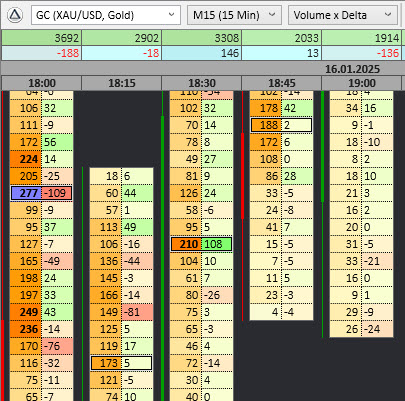
2. Imbalance
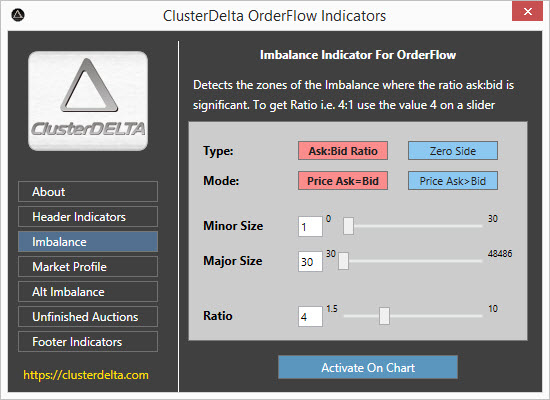
The Imbalance indicator shows you the zones where the ratio between Ask and Bid values is abnormal. The main option is the Ratio coefficient. When the result of dividing of Ask:Bid or Bid:Ask is more than the Ratio, there's imbalance. There are two types of imbalances. The Ask:Bid Ratio calculates the value and compares it to the Imbalance Ratio when the Zero side is just an imbalance where the left or right part has no volumes (zero value).There are two modes of imbalances. Price Ask=Bid calculates the ratio between Ask and Bid in the same row (on the same price) when Ask>Bid uses for calculations Ask volume above Bid volume.
There are preconditions to get imbalance more accurate. Minor Size is a minimum value of lesser value in calculation, and Major Size is a minimum value of greater part of Imbalance. If you change the Minor Size to a value of 0, Orderflow app will also mark Zero Imbalances if the Major Size condition is met.
Default values located at Settings -> Chart Indicators
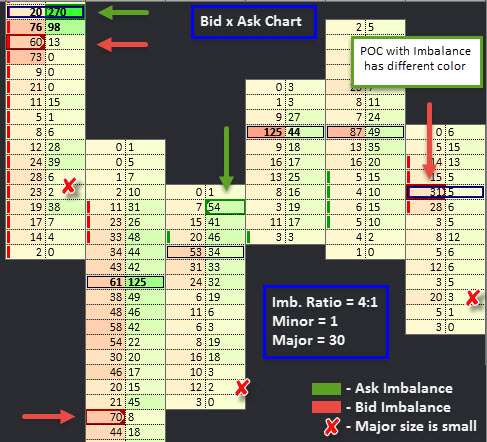
By default settings Bid Imbalance is marked by red color and Ask Imbalance by green. Check the imbalances above: 270:20 = 13 that is greater than current Ratio that is 4 (you can change Imbalance Ratio within range 1.5 - 10), 60:13 >4, 70:8 >4, and so on. 23:2 >4, but 23 is less than Major value (30) so it is not marked as an Imbalance. When Imbalance and POC are on the same price, POC has different color (Settings -> Chart Indicators, options are Highlight Imbalance on POC price, Color to Highlight POC).
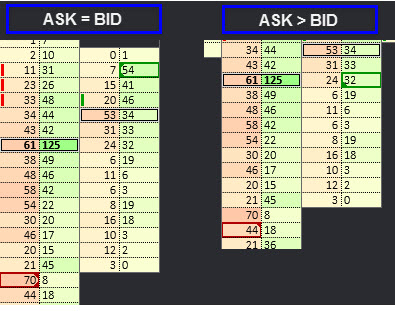
If cell value type is Bid or Ask, Imbalance marks only the larger side of the Imbalance pair. Depending on the Imbalance Mode, you can find small arrows that represent the placement of the opposite value to which the calculation was made. Two arrows at the top and bottom of the imbalance object means that the imbalance was calculated with a value on the same row. The arrow at the Top of the Bid imbalance or at the Bottom of the Ask imbalance represents the direction of the opposite value when Imbalance type is Ask price > Bid price .
In general, Imbalance do not use high or low position of the candle but it is may be changed in the Settings -> Chart Indicators, option Calculate Imbalance on High/Low. Also there are some more options related to Imbalances, the ranges of the Minor/Major values and so on. All of them are described in the Settings section.
4. Alternative Imbalance
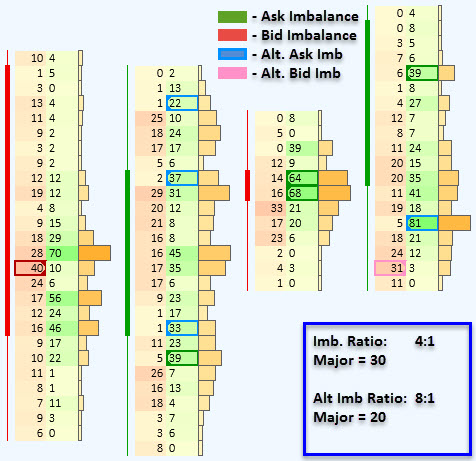
Alternative Imbalance is the possibility to separate the high Ratio Imbalances from the Normal ones. The Alternative Imbalance Range is 1.5 - 30 and it is required that Alt.Ratio must be greater than Ratio of the Normal Imbalance because Alternative Imbalance always overwrites Normal Imbalance.
Alternative Imbalance has completely its own settings so the options are not shared between Normal and Alternative Imbalances
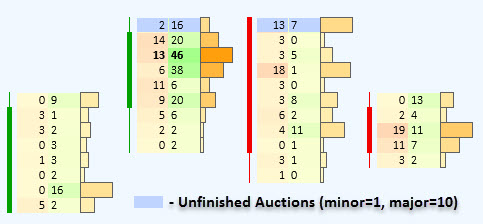
5. Unfinished Auctions
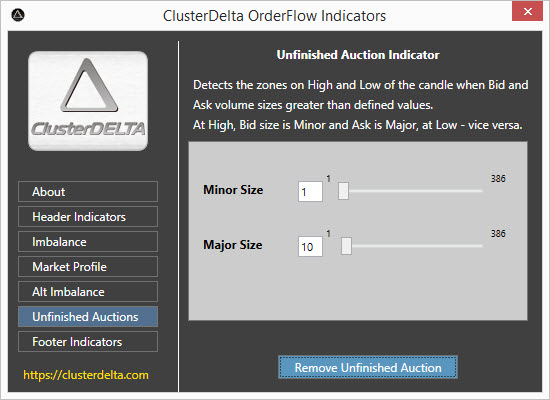
Unfinished auctions is the zone only at the high price or low price of the bar where both values of Ask and Bid are not zero. The presence of the opposite value shows that prices has attention to move further with the same direction but was met by a pressure from the opposite side and had to be reversed.
In order to filter out unnecessary unfinished auctions, there are Minor and Major sizes, which correspond to the lower and higher sizes of the Ask:Bid pair at the peak of the candle. Auctions are usually finished when the highest price has a bid size as zero and the lowest price has a ask size as zero.
6. Footer Indicators
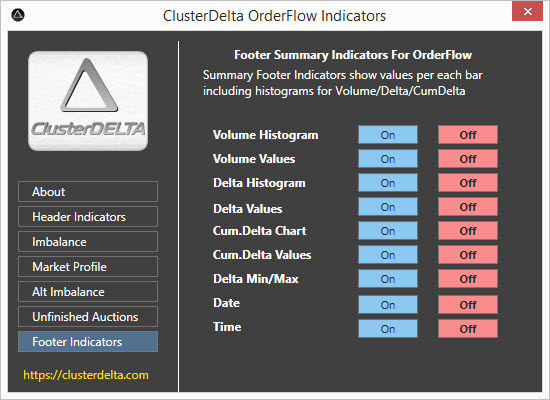
The bottom area of the workspace is used by Footer Indicators. The full list of the Footer Indicators is the same as Header Indicators, and the showed data and values are the same too . The difference only that Volume / Delta / Cum.Delta indicators also have the option to visualize their data as the histograms with or without the panel with absolute values. Also clicking on a Footer Time panel does not do anything compared to the same action on a Header Time panel that applies to a Volume/Delta Profile.
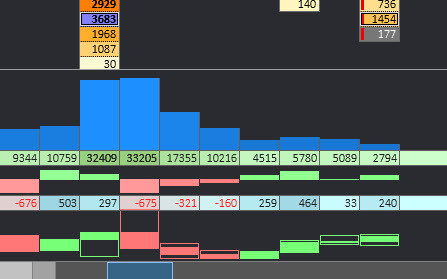
The Footer Indicator Histograms can be resized by the user by simply dragging the histogram window at the top edge of the window (when the mouse cursor changes its image to ↕). Default settings, colors and predefined height of histogram are locate in the Settings -> Summary Indicators
The Font Size and Height of the Cell with absolute values can be changed in the Settings by changing the option Summary Cell Height, Min Font Size for Summary Info and Max Font Size for Summary Info. These options are shared with Header Indicators.
7. Point Of Control (POC)
POC is a price where the maximum volumes in the bar were traded (comparing to other values). It is allowed to have two or more POCs if their values are the same and they are the maximum values in the bar. The POC rounds the data by two rectangles and may get a different color if it is on the same price with Imbalance (depends on the Imbalance settings). The POC can be switched on/off from the Settings -> Chart Indicators, POC Settings section. There you can change the POC colors too.
8. Value Area and VAL/VAH
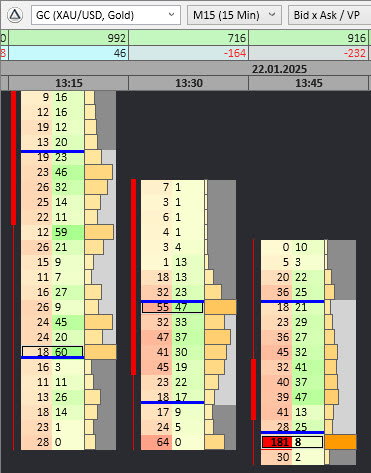
Value Area (VA) is a value area marked by VAH (Value Are High) and VAL (Value Area Low) levels. Value Area is the area within Volume Profile where there is an defined amount of volume. By theory of XX century the amount of Value Area has to contain 80% of total volumes. The first standard deviation value of 68% seems more logical and you are able to change it in the settings. The Value Area can be marked by the lines on the VAH and VAL prices (here as the blue ones) and as the different background color on the profile cell type. The VAH/VAL options located at the Settings -> Chart Indicators, VAL/VAH Settings section. There you can change the color and percent of Value Area too.
9. Indicators Chart Area
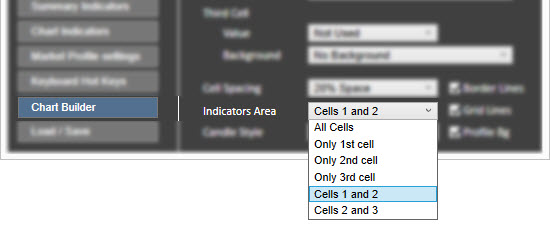
All Chart Indicators respect the "Indicators Area" Chart Type Option . This option determines which cells are used to draw indicator objects. For example, if you have a Bid x Ask x Profile chart , you probably won't need to use a Profile cell to draw indicators, than you would change the "Indicators Area" option to a value "Cells 1 and 2". On the other hand, if you feel that indicators do not draw their objects in relative cells, just check what is the value of the "Indicators Area" option . It is located at Settings -> Chart Builder.

