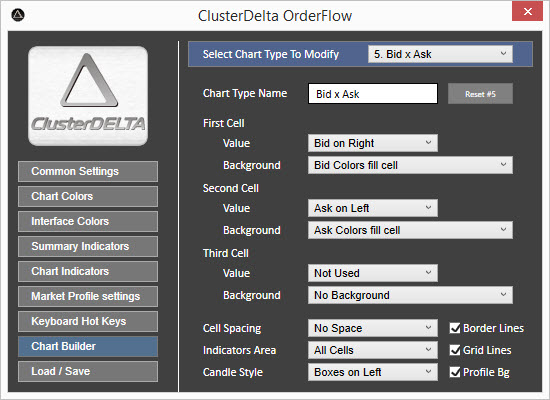
The Chart Builder allows you to customize the chart according to your needs. To rename the chart type, just put the new name into the Chart Type Name textbox. After rebuilding the "Chart Type" do not forget to Save settings (using the Load/Save section) if you want to use them in the future. To the right of the Chart Type Name field there is a Reset button, which restores the settings of the current chart to the ones they were at the start.
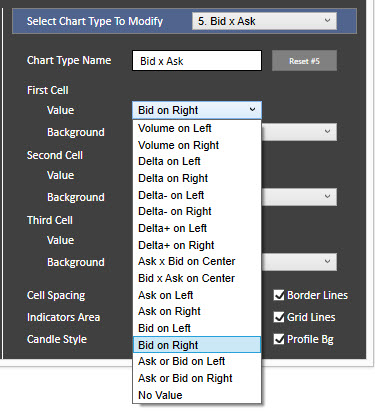
The chart can be split up in 3 cells. Each cell contains a value and a background. In each cell, the value can be one of the following: Volume, Delta, Delta Negative only, Delta Positive only, Ask, Bid, Ask or Bid (larger value), Ask and Bid (or Bid and Ask) or No Value.
Each value can be left- or right-aligned ("Ask x Bid" or "Bid x Ask" are center-aligned). "No Value" is useful if you intend to use to use a cell with a background profile, but, in general, with no value, any background is acceptable. The values "Bid x Ask" and "Ask x Bid" are included to use one background (like a volume profile) behind these values.
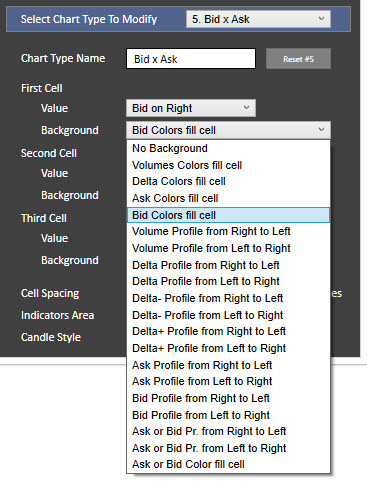
Each cell contains one of the available backgrounds (which have the "No Background" option . The background can fill the cell with its own color depending on its type, or it can be used as a profile whose length is a part of the cell in the same ratio as the value (corresponding to the type of background) relative to the maximum value for that type. Profiles can be directed from Left to Right or from Right to Left, where the first word defines the starting side of the cell.

There are 6 additional options for the Chart Builder

Cell Spacing is the distance between neighboring bars. If the Cell Spacing option is "No Space", it does not allow to draw simple OHLC candle to the left or right of the bar. The value sets the amount of space between bars.
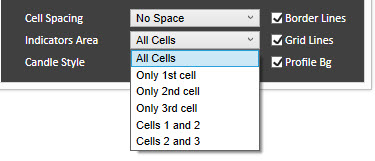
Indicators Area defines which cells can be used to place Indicator objects. For example for the chart like Bid x Ask x Volume or Bid x Ask x Volume Profile, it is not necessary to use the 3rd cell for indicators, because two cells of Bid x Ask are more than enough to place the Indicator objects in the right way.
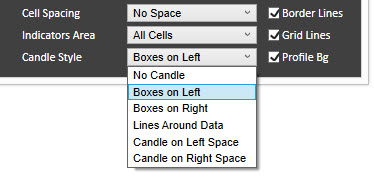
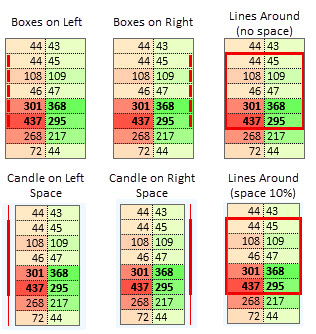
Candle Style option allows you to select the type and style of the Bull/Bear candle you would like to use. The style of the Boxes or Lines Around shows only the body of the candle and the remaining part of the bar at the top and bottom are the wicks. The Candle on the Left/Right Space looks like a simple OHLC candle. There are examples on the image below.
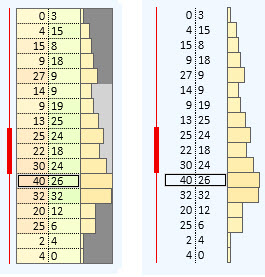
Border Lines are the solid lines around the all cells of the current bar. They are not drawn If this option is turned off.
Grid Lines are the dotted horizontal and vertical lines between the cells of the current bar. They are not drawn If this option is turned off. It is possible to draw on vertical lines by enabling the option Grid Lines and disabling the option Chart Colors, Global on Draw Horizontal Grid option.
Profiles Bg option determines whether the profile in the cell is drawn with the background color or not.


