
")
Indicator name: ClusterDelta Splash
The Splash indicator is the first indicator in the ClusterDelta series that deeply analyzes tick history. This indicator is designed to search for large spikes in volume, when a large amount of the volume has passed in a short period of time.
The nature of the exchanges allow buyers and sellers to act together, and even the presence of a large player on the tick chart will not be obvious, since any large order in the process of execution will be split into many small orders, depending on the number of participants. But there are situations when sellers and buyers with large volumes meet together. Then big volumes slip in the tape - for example, 60 or 100 lots in one tick. Usually we call this the presence of smart money, counting on that they control the market, and we should monitor their actions. The indicator is designed to collect the fragmented trades of large players into one order that is called Market Splash.
DESCRIPTION OF THE SPLASH INDICATOR PANEL
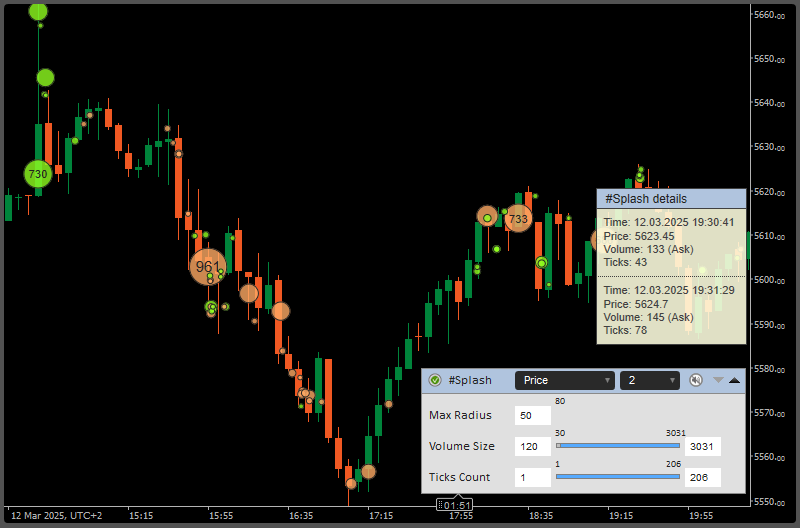
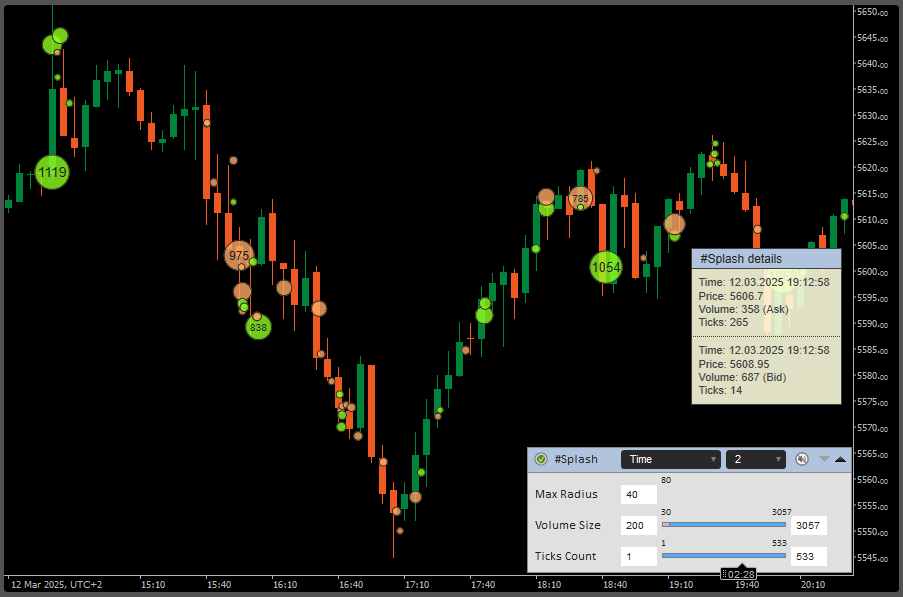
The Title of the Splash panel contains the "Authorizer" icon, the indicator name, the method of ticks aggregation, the number of days to load to load and display, where the value "None" removes Splash data from the chart, an Alert icon, an icon (arrow down) to open the Advanced Panel and the next icon (arrow up) to close the current Splash GUI panel. The hot key 'Z' hides this panel, and hot key 'X' shows it again.
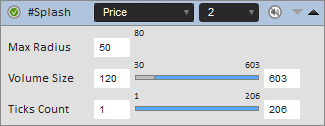
Advanced Panel has the options for the Splash indicator.
Max Radius determines the object size. 0 is for automatic value. The Splash size is shown if the object size is enough big to fit this text.
Volume Size is the minimum value and maximum value of the volume amount that is required to show it as the Splash object.
Ticks Count is the number of ticks that were used to aggregate the data into a Splash object. It can also be delimited by a minimum and maximum value
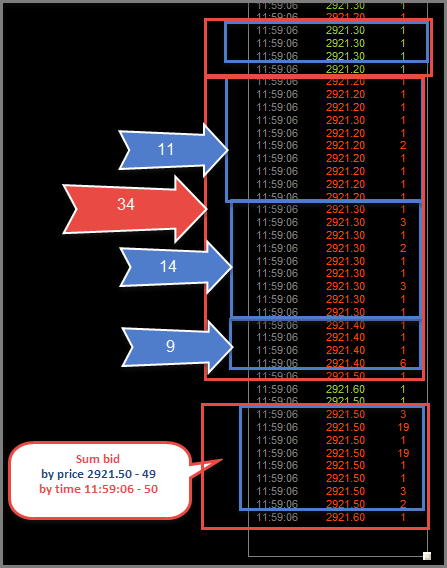
Here is a small example of aggregation. In the "Raw" mode each tick is just filtered by its size. The "Price" mode is the ticks grouped by the same price, same direction in the same time moment. You can see the "Price" mode aggregation in the blue boxes. The "Time" mode ignores price changing and only use the direction and time. It is represented by "Red" boxes.
CLUSTERDELTA SPLASH INPUTS DESCRIPTION
Common Settings describes the basic parameters of the indicator. The standard behavior of cTrader when changing values of any settings is to immediately reload indicators, which requires remote access to ClusterDelta servers to reload data, so it is highly recommended to change all settings the first time you attach an indicator to a chart. Options starting with '*' (asterisk) cannot be changed after the indicator is attached, as they are part of the GUI panel. Use the GUI panel to change the options allowed there, but in case you need to change options in the cTrader indicator settings panel, it will be easy to remove the indicator and reattach it with new settings changes./p>
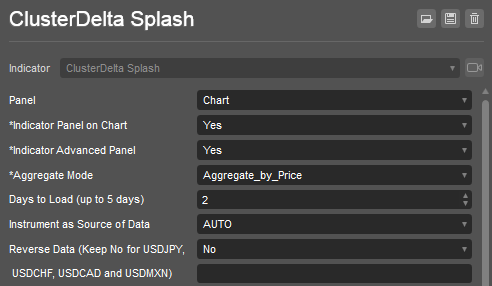
Panel is the indicator location. The current indicator works with the "Chart" value only
Indicator Panel on Chart shows or hides the Splash Panel on start
Indicator Advanced Panel shows or hides the Advanced Panel on start
Aggregate Mode is a calculation mode. Its values "Raw Ticks", "Price" and "Time" were described above.
Days To Load (up to 5 days) is the number of the days to load in history. To not overload server side do not use the big values. To get more data in history use the option "Build Back (Days to Skip)" in the Advanced settings section.
Instrument as Source of Data - select a futures from the dropdown list as the source for data. Value AUTO causes automatic detection of the instrument using the cTrader ticker.
Reverse Data is an option for reverse the indicator data for reversed currency pairs except those that have name "USDJPY", "USDCAD", "USDCHF", "USDMXN". This option was added for compatibility, but in 99.9% of cTrader cases leave it "No".
Advanced Settings
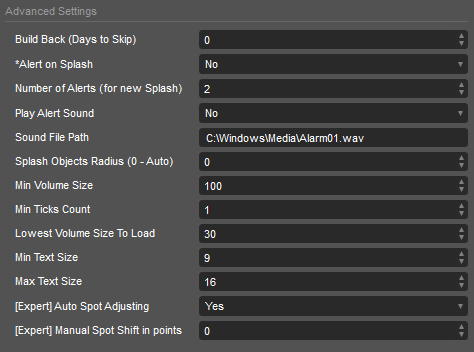
Build Back (Days to Skip) is the option to work with history data. It determines the number of days to skip from the current date and then load the required historical data using the "Days to Load" setting from the Common Settings.
Alert on Splash initiates the Alert event when the Splash just appeared on the current bar.
Number of alerts is an option for how many times to initiate a new splash alert event.
Play Alert Sound is an option for the sound file to be played when an alert event is triggered.
Sound File Path must be an existing path to a sound file to play when an alert event is triggered. It must be filled by user in a format like the field below: "C:\Windows\Media\Alarm01.wav"
Splash Object Radius is the setting for "Max Radius" option in indicator panel. This value is the maximum size for the Splash object with a maximum volume. 0 is for automatic resizing.
Min Volume Size is the filter for the minimum Volumes to show by Splash indicator.
Min Ticks Count is the filter for the minimum amount of ticks that were used during ticks aggregation to a Splash object.
Lowest Volume Size To Load is the filter for the minimum volume size that will be loaded from Server to allow use change min volume size directly on the chart and to not overload terminal by unnecessary data as it may cause terminal freezing .
Min text size is the smallest text size that will be used to display the Splash value when the Splash Object width/height will be large enough to fit the Splash value inside.
Max text size is the maximum text size that will be used to display the Splash value.
[Expert] Auto Spot Adjusting is an option that allows you to adjust indicator data to the spot chart using the latest highs and lows of the current trading session. The difference that is automatically calculated using this option may vary from trading session to trading session, so this may result in incorrect alignment of indicator data for different trading sessions.
[Expert] Manual Spot Shift in points sets the manual value to be used to adjust indicator data to the spot chart. Use the middle mouse button to measure the distance in points to use this value in this option.
Splash Colors
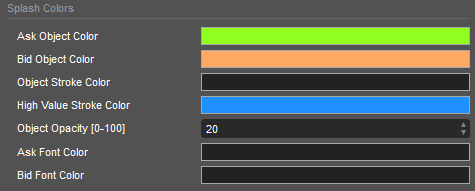
Ask Object Color is the color of the Splash object that used Ask prices
Bid Object Color is the color of the Splash object that used Bid prices
Object Stroke Color is the border color around the Splash object.
High Value Stroke Color is the additional border color around the Splash object with large amount of the volume.
Ask Font Color is the color of the text for Ask Object.
Bid Font Color is the color of the text for Bid Object.
Tips and Social Networks
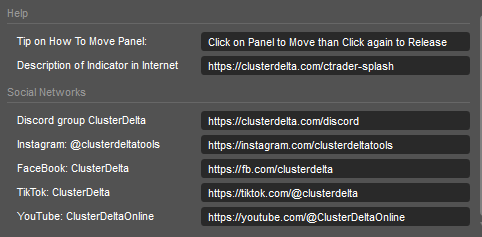
Help section is the small tip on how to move the indicator panel and the URL on where to get the full documentation about indicator
Social Networks are the links to join our Discord and follow us in the Instagram and other social networks

