
")
- About / How to Start
- Instruments List
- Timeframes
- Chart Types
- Tick Multiplier
- Indicators
- Vertical / Horizontal Lines
- Chart Cell Width
- Chart Cell Height
- Cell Font Size
- Authorizer / ClusterDelta Manager
- Instruments Window
- Settings
- Navigation Icon "Move Right"
- Navigation Chart Window
- Navigation Icon "Move Left"
- Calendar Icon for Load History Data
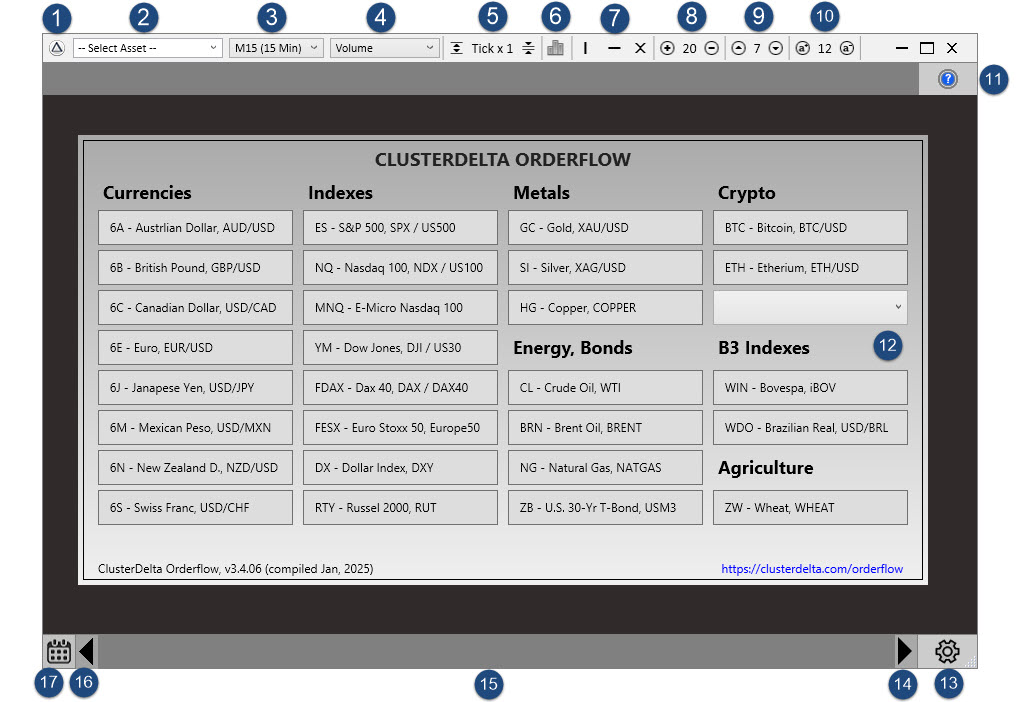
The current version of CD app is adapted on any screen resolution and monitor orientation even if you are using more than 1 monitor with different resolutions/orientations.
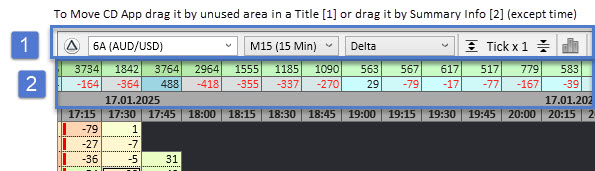
To Move CD App drag it by unused area in a Title 1 or drag using the area where the Summary information 2 is located (except time). Resize the application window by dragging the bottom right corner (dotted triangle right to Settings icon).
1. About / How To Start
Using this icon opens a new window following a customer to an instruction with quick links on what to do before starting work with ClusterDelta Orderflow Application (Registration / Funding Account and Ordering Subscription / Enter the customer data such as the Clusterdelta username and password to Authorizer)
2. Instruments Lists
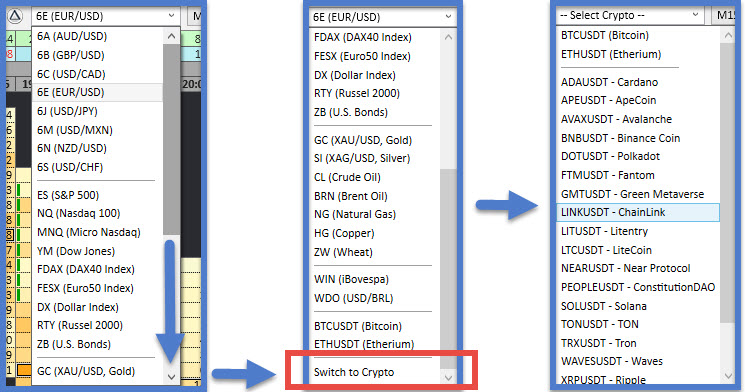
Instruments List allows to change the current instrument to another one. To switch to crypto, scroll down and use the "Switch to Crypto" item, then open the list again and the content of it will be changed by Crypto Coins. To return to normal instruments list, scroll down, select the last item "Switch to Assets" and open the list again.
3. Timeframes
The list of predefined timeframes. The most used M1-M5-M15-H1-D1 on the top and after the list of the rest TFs. The "Custom" timeframe in the list allows trader to use any timeframe by any number of minutes. To use custom timeframe change the appropriate option in the Settings (see Settings -> Common Settings, Custom Timeframe Value)
4. Chart Types
The list for custom chart types to show footprint chart in a different views. Here you can find Volume, Delta, Bid x Ask, Volume x Delta, Bid x Ask with Volume Profile and other charts used with different color schemes and profiles. Chart Types may be changed by a trader in the Chart Builder (see Settings -> Chart Builder) so you can build any combination of Volumes / Delta / Bid x Ask / Profiles on your own choice. Each chart type assigned to a hotkey 1,2,3,4,5,6,7,8,9 by its number according to its order, and 0 for the 10th chart type.
5. Tick Multiplier
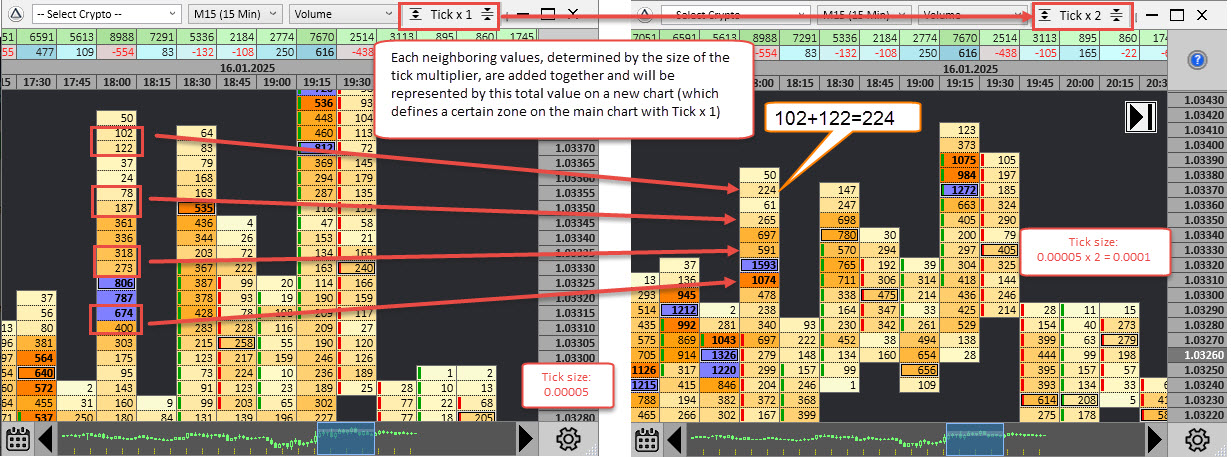
This option allows you to shrink or expand the chart to see the values in most useful way that is very useful for a high volatility charts (some charts like Nasdaq100 or Bitcoin have a such large volatility that it makes no sense to see footprint chart in a raw tick x 1 view). Each neighboring values, determined by the size of the tick multiplier, are added together and will be represented by this total value on a new chart (which defines a certain zone on the main chart with Tick x 1). The value of the tick multiplier maybe changed in Settings (see Settings -> Common Settings, Tick Multiplier) that allows to keep a different default value in the workspaces.
Use the icons to the left/right of the Tick value to decrease/increase the tick multiplier. When the multiplier becomes greater than the x30 value, the changing step will be increased to 10 and when the multiplier reaches x100, the step becomes x50 (max value of multiplier is 1000). Right mouse button click directly to Tick Multiplier value resets the its value to 1.
Hot Keys:
- / (numpad) - Decrease Tick Multiplier
- * (numpad) - Increase Tick Multiplier
6. Indicators
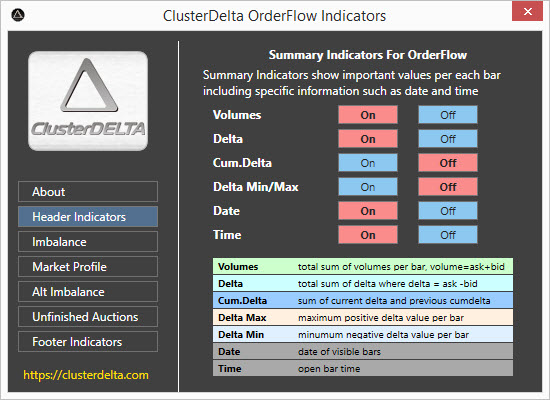
The indicators icon opens an external window that allows you to apply indicators directly to the chart or remove them from the chart. More detailed information about indicators can be found in the Indicators. In the Settings (see Settings -> Summary Indicators, Settings -> Chart Indicators, Settings -> Market Profile) you can change the default indicator set and indicator values for different workspaces. Hot Key I (i) shows this window.
Hot Keys:
- M - Imbalance On/Off
- N - Alternative Imbalance On/Off
- U - Unfinished Auctions On/Off
- V - Volume Profile On/Off
- D - Delta Profile On/Off
- [ - Cum Delta on Summary Top On/Off
- ] - Min/Max Delta on Summary Top On/Off
7. Vertical and Horizontal Lines
You are able to draw the horizontal and vertical lines (due to technical requirements the lines are drawn behind of the chart). Each new attempt to draw a line, overwriting the old one, changes the line color (up to 3 colors). The 4th click on overwriting an existing line deletes it.
[ x ] icon draws a line deletion object that erases the line by clicking on it.
Hot Keys:
- Left Shift (hold) - initiates the horizontal line by drawing a draft object with a price on which to place the new line (see the line in the image below mouse cursor).
- | (bar) or \ (backslash) - Initiates a drawing a vertical line (can be canceled by Left Shift pressing)
- Ctrl (hold) - Initiates the drawing of removing object to remove lines behind it by left mouse click
Each drawing initiate can be canceled by ESC key
8. Chart Cell Width
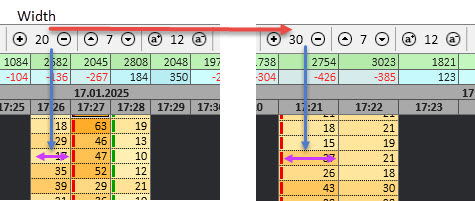
This value is the cell width size (that is not defined in pixels). Use increment / decrement icons to the left / right from the value to change value that immediately redraws the chart using a new value.
Hot Keys:
- - - Decrease Cell Width value
- + - Increase Cell Width value
9. Chart Cell Height
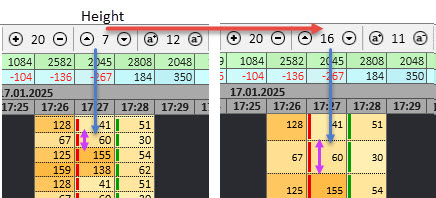
This value is the cell height size (that is not defined in pixels). Use increment / decrement icons to the left / right from the value to change this value that immediately redraws the chart using the new value. The Chart Cell Height value does NOT affect the height of Summary Indicators and, for summary info, it can be changed by its own height option in the Settings -> Summary Indicators , Summary Cell Height.
10. Cell Font Size
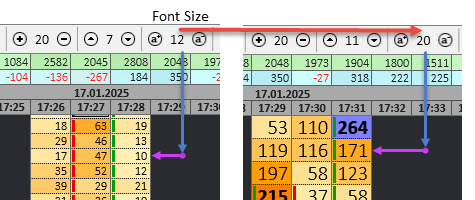
This value is the cell font size. Use increment / decrement icons to the left / right from the value to change this value that immediately redraws the chart using the new value. The Cell Font Size value does NOT affect the font size in the Summary indicators. The font size in the Summary Indicators is calculated differently using its own width/height of the cell and a range of min/max font sizes that can be changed in the Settings -> Summary Indicators , Min/Max Font Size for Summary Info.
Cell Width / Height / Font Size can be changed by mouse wheel that is used as Zoom - / Zoom + option and changes the values simultaneously. Also, the Enter (numpad) hot key can change values to hard-coded predefined sets that change with each next pressing of the Enter key.
The default values for these parameters are as follows: Width = 20, Height = 7, Font Size =12
11. Authorizer / ClusterDelta Manager
The icon shows the current status of your access to clusterdelta server.
- Blue with ? symbol - the status is unknown yet
- Red with access denied icon - the current access is denied and the possible reasons are: wrong username/password, no or expired subscription, too many IPs in use.
- Green with check mark - the access is ok
- Orange Icon with triangle and ! symbol - the access is still ok but maybe turned off in a future. Possible reasons: subscription expires in the next 2 days or authorization was granted by an alternative method and is still active, but the access can't be granted in the future by current authorizer with the current username / password.
Click to this icon to call Authorizer Window. To check on how to use it see Overview section.
12. Instruments Window
Instrument window is the window shown after the app start. It just a useful method to select instruments and see all available tickers with their description. To see all the crypto coins, just use drop-down list in the Crypto section of this window. If you want to call this window later, use the hot key L.
13. Settings
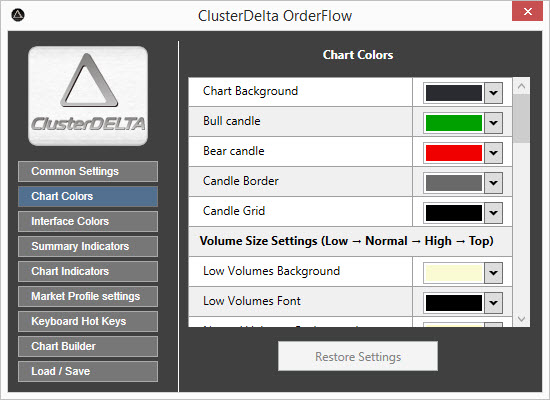
All global settings that controls ClusterDelta Orderflow Application are located there. Any parameter you change in the settings immediately applied to the chart (except for a few critical options in the "Common Settings" that requires restarting the application). Using the "Load / Save" options, you can export your settings to a file or save them as defaults and they will be used for next launches of the application. Keep in mind that settings that are not saved will be lost when you close the application.
Most options are still compatible with MetaTrader preset of the ClusterDelta_#Footprint indicator. This allows you to import settings from MT Footprint to the ClusterDelta Orderflow app and vice versa. During recent updates and improvements to the app (and MT Footprint), compatibility has become less effective due to a different logic in some places, so if you do use this connectivity, you will need to double-check and readjust the options.
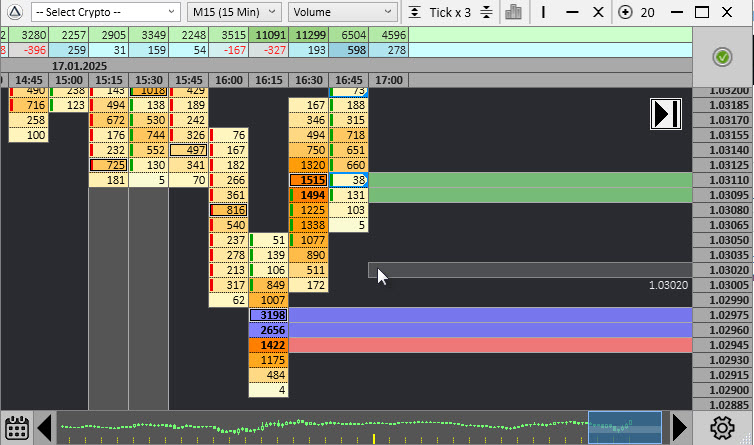
14-16. Navigation Toolbar
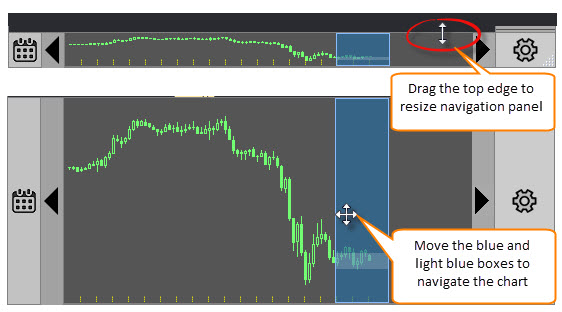
Navigation toolbar allows you to quickly navigate through the loaded chart. On the navigation toolbar mouse cursor appears as North-South Arrows or NSWE Arrows. You can resize the navigation toolbar by dragging the top edge vertically. The NSWE arrows cursor (with left mouse button pressed) is used to navigate the chart.
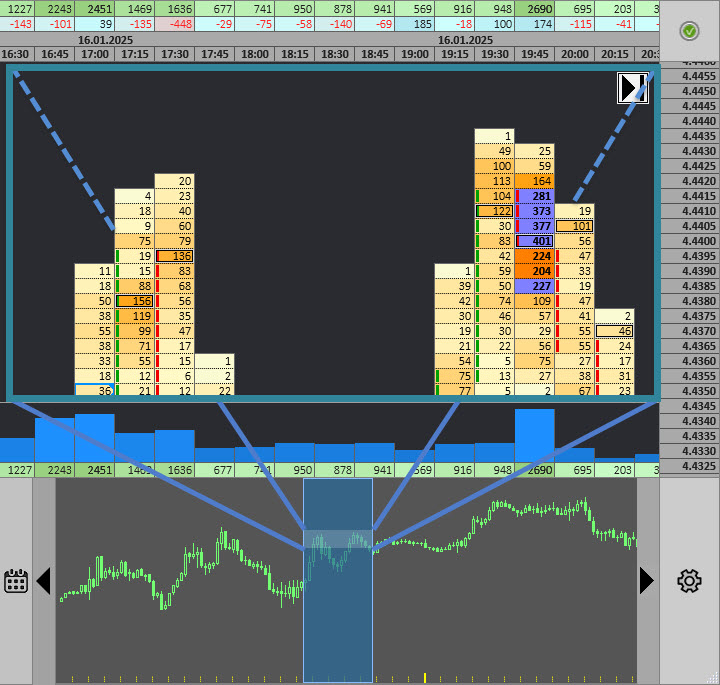
The chart shows the loaded data in the CD app, which can be displayed. Yellow dashed lines at the bottom mark the beginning of each hour. The bold solid yellow line marks the beginning of a new day. The dark blue frame corresponds to the time shown at the beginning and end of the visible workspace. The lighter rectangle inside the dark blue frame visualize the exact price range of the chart at the top and bottom of the visible workspace. In general, we can say that light rectangle inside the dark blue frame is the actual information that is displayed in the workspace now. Dragging the light rectangle allows you to quickly change the chart area to see it.
The bold Left and Right arrows on the sides of the chart change the current position according to the size of the workspace (one screen left / one screen right).
Hot Keys:
- PgUp - change chart position to one screen left
- PgDn - change chart position to one screen right
- Arrow Up / Arrow Down - move chart vertically up/down for 4 ticks
- Arrow Left / Arrow Right -move chart horizontally left/right for 2 bars
- Home -move chart to first loaded bar
- End -move chart to loaded bar and switch the mode of chart control to "Follow the current price"
17. Calendar Icon for Load History Data
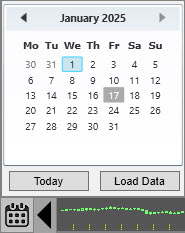
The Calendar is required to load data of history dates for backtesting. Just click on the icon to show the calendar, select a the required date and click on the "Load Data" button. To return to the normal mode, you have to select the current date or click on the "Today" button and click "Load Data" again. For timeframes smaller than H1, the data is downloaded for one trading session. For higher timeframes, the data is loaded for one week. Online mode is disabled unless you've chosen today, yesterday or before yesterday date.

