
")

Indicator name: ClusterDelta DPOC
POC (Point Of Control) is the price level for the period of time where the largest amount of volumes was traded. So the price of the biggest volume in a Market Profile is POC.
DPOC (Dynamic Point of Control) is a line on a chart of how the POC moves over a period of time.
The ClusterDelta DPOC indicator is a change of the POC level over time, where the calculation point is the maximum volume level (POC = Point Of Control). This indicator shows the previous positions of the maximum volume, which allows you to understand the its evolution. Value Area High (VAH) and Value Area Low (VAL) are the prices of Value Area where the most volumes were traded (the percentage of traded volumes is defined by Value Area Percent option).
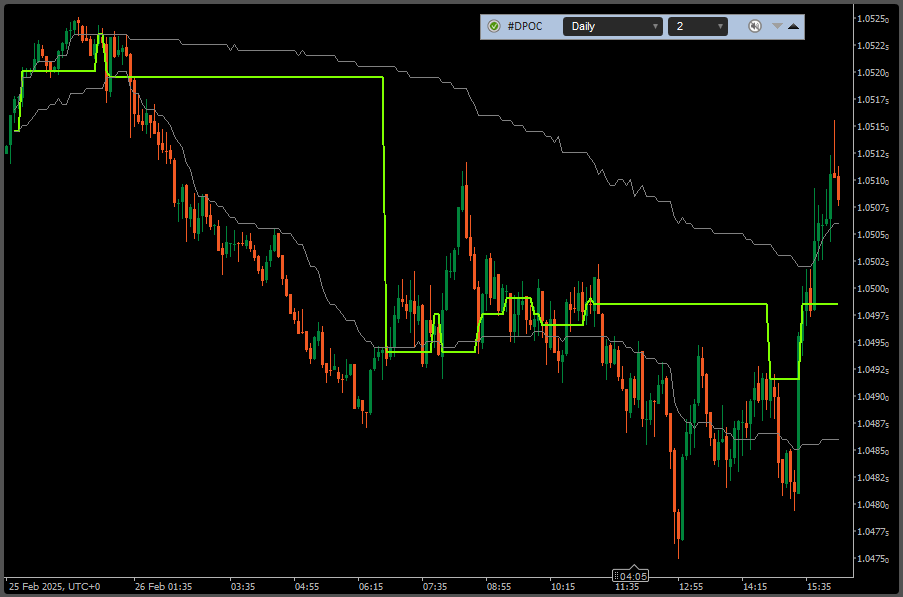
The DPOC on the screen above shows the yellow line (POC) and grey lines (VAH/VAL) on the chart point toward to Volume Profile indicator POC/VAH/VAL on the right side of the window.
The general idea of the indicator is that you can see the evolution of the volume profile in the period in terms of change of the price of maximum volume accumulation (POC). Quite often, some minutes before market close, large enough volumes comes out (due to overnight margins increasing ), which distort the actual levels of the maximum volume at the end of the day, so this indicator indicates the significance of the price level in the period.
DPOC sometimes allows you to detect levels "hidden" by time, describing the movement of volume within a day or week. This indicator allows you to build charts of dPOC changes in series.
DESCRIPTION OF THE DPOC INDICATOR PANEL

The DPOC panel contains the "Authorizer" icon, the indicator name, the number of DPOC periods to load and display, where the value "None" removes dPOC data from the chart, an Alert icon and an icon (arrow up) to close the current DPOC GUI panel. The hot key 'Z' hides this panel, and hot key 'X' shows it again.
The cTrader has some limitations for custom objects, so to move the panel among the window, there is a small trick: click to the indicator name and release the mouse button (the title will change its name to display the data source and the control with the amount of days will hide), move the mouse out of the GUI panel and the panel will follow the mouse cursor, then click again on the indicator name again to turn off the panel moving mode.
To switch between the Alert modes, just click to the Alert Icon
CLUSTERDELTA DPOC INPUTS DESCRIPTION
Common Settings describes the basic parameters of the indicator. The standard behavior of cTrader when changing values of any settings is to immediately reload indicators, which requires remote access to ClusterDelta servers to reload data, so it is highly recommended to change all settings the first time you attach an indicator to a chart. Options starting with '*' (asterisk) cannot be changed after the indicator is attached, as they are part of the GUI panel. Use the GUI panel to change the options allowed there, but in case you need to change options in the cTrader indicator settings panel, it will be easy to remove the indicator and reattach it with new settings changes./p>
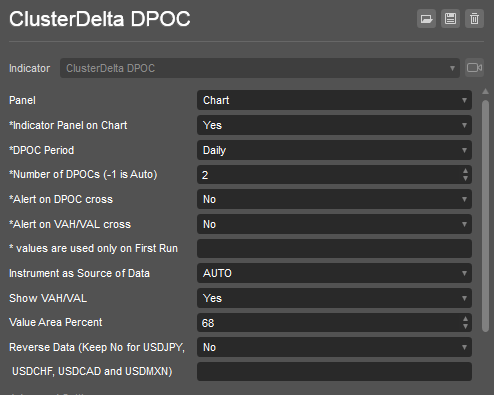
Panel is the indicator location. The current indicator works with the "Chart" value only
Indicator Panel on Chart shows or hides the DPOC Panel on start
DPOC Period is the time range (Hour, Day, Week) on which indicator is calculated its values.
Number of DPOCs is an amount of period to load data for the DPOC indicator.
Alert on DPOC cross initiates the Alert event when the price crosses the dPOC line.
Alert on VAH/VAL cross initiates the Alert event when the price crosses the VAH/VAL line.
Instrument as Source of Data - select a futures from the dropdown list as the source for data. Value AUTO causes automatic detection of the instrument using the cTrader ticker.
Show VAH/VAL is the option whether to show VAH/VAL lines. VAH/VAL Lines shows the dynamic of Value Area changing.
Value Area Percent - the percentage of Value Area at which the specified volumes amount was traded.
Reverse Data is an option for reverse the DPOC data for reversed currency pairs except those that have name "USDJPY", "USDCAD", "USDCHF", "USDMXN". This option was added for compatibility, but in 99.9% of cTrader cases leave it "No".
Advanced Settings
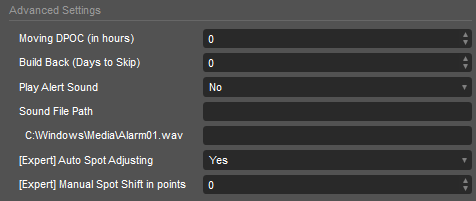
Moving DPOC (in hours) is the option to calculate dPOC ony using the data of the last hours defined by this value. It allows you to cut off the old date that would be outdated for DPOC calculations.
Build Back (Days to Skip) is the option to work with history data. It determines the number of days to skip from the current date and then load the required historical data using the "Days to Load" setting from the Common Settings.
Play Alert Sound is an option for the sound file to be played when an alert event is triggered.
Sound File Path must be an existing path to a sound file to play when an alert event is triggered. It must be filled by user in a format like the field below: "C:\Windows\Media\Alarm01.wav"
[Expert] Auto Spot Adjusting is an option that allows you to adjust DPOC data to the spot chart using the latest highs and lows of the current trading session. The difference that is automatically calculated using this option may vary from trading session to trading session, so this may result in incorrect alignment of DPOC data for different trading sessions.
[Expert] Manual Spot Shift in points sets the manual value to be used to adjust DPOC data to the spot chart. Use the middle mouse button to measure the distance in points to use this value in this option.

