
")
Indicator Name: ClusterDelta OHLC Chart
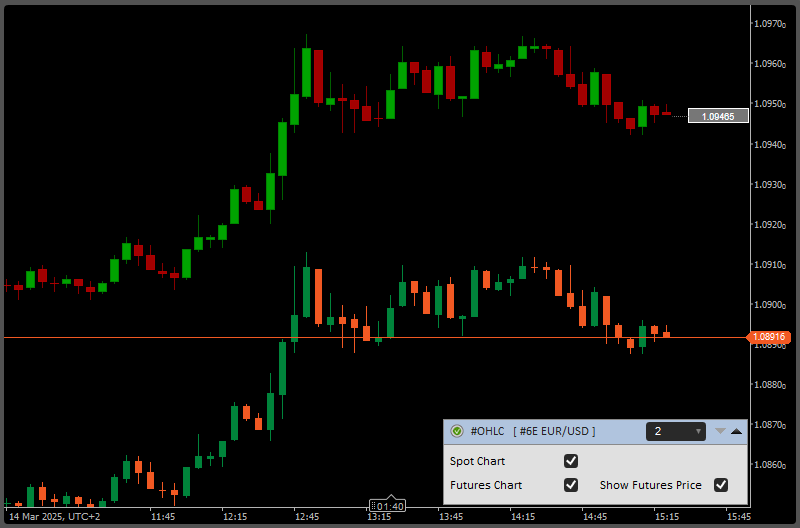
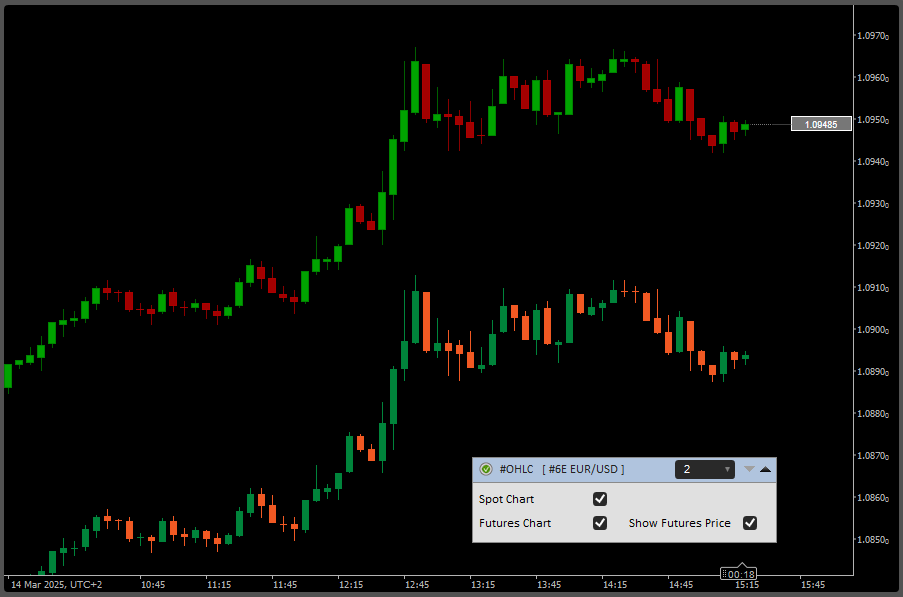
The indicator is designed to demonstrate a futures chart over a spot chart. This will make it possible to see the correlation between the two charts, determine the value of Manual Shift point, or use indicators directly on the futures chart.
The #OHLC_Chart indicator loads the futures chart over the native forex/spot chart. It is very important that the tick size of the spot chart matches the tick size of the futures in the number of decimal places after the point.
Sometime, a spot may move differently from a futures, and if the spot is analyzed through the the futures data, a data inconsistency may be found. This indicator will help to understand where these inconsistency are located and to analyze the reasons.
All ClusterDelta indicators are based on futures data; therefore, if you wish, you can turn off the spot correction (forex_shift_auto / forex_shift inputs) and use them directly with futures charts.
This indicator has a graphical panel with interactive options for displaying and disabling the futures / spot chart, and also the option to display or hide the current futures price.
DESCRIPTION OF THE OHLC CHART INDICATOR PANEL
The Title of the OHLC Chart panel contains the "Authorizer" icon, the indicator name, the number of days to load to load and display, where the value "None" removes OHLC chart from the current window, an icon (arrow down) to open the Advanced Panel and the next icon (arrow up) to close the current OHLC Chart GUI panel. The hot key 'Z' hides this panel, and hot key 'X' shows it again.
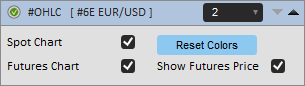
Advanced Panel has the options for the OHLC Chart indicator.
Spot Chart - display / hide the spot chart in the workspace. The spot chart is a native chart that provided by cTrader
Futures Chart - display / hide the futures chart in the workspace
Show Futures Price - display / hide the current futures price
Reset Colors. This button is hidden by default and appears only if the current colors of the spot chart are not the same as the cTrader defaults. Sometimes, due to the use of the Spot chart indicator function, the colors of the Spot chart may not be correct. This button restores the default colors.
CLUSTERDELTA OHLC CHART INPUTS DESCRIPTION
Common Settings describes the basic parameters of the indicator. The standard behavior of cTrader when changing values of any settings is to immediately reload indicators, which requires remote access to ClusterDelta servers to reload data, so it is highly recommended to change all settings the first time you attach an indicator to a chart. Options starting with '*' (asterisk) cannot be changed after the indicator is attached, as they are part of the GUI panel. Use the GUI panel to change the options allowed there, but in case you need to change options in the cTrader indicator settings panel, it will be easy to remove the indicator and reattach it with new settings changes./p>
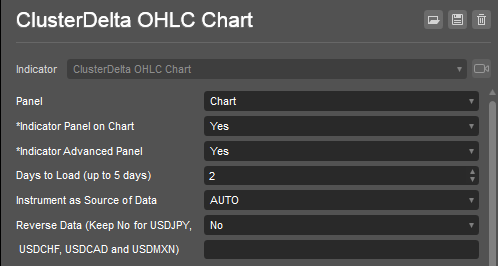
Panel is the indicator location. The current indicator works with the "Chart" value only
Indicator Panel on Chart shows or hides the OHLC Chart Panel on start
Indicator Advanced Panel shows or hides the Advanced Panel on start
Days To Load (up to 5 days) is the number of the days to load in history. To not overload server side do not use the big values. To get more data in history use the option "Build Back (Days to Skip)" in the Advanced settings section.
Instrument as Source of Data - select a futures from the dropdown list as the source for data. Value AUTO causes automatic detection of the instrument using the cTrader ticker.
Reverse Data is an option for reverse the indicator data for reversed currency pairs except those that have name "USDJPY", "USDCAD", "USDCHF", "USDMXN". This option was added for compatibility, but in 99.9% of cTrader cases leave it "No".
Advanced Settings
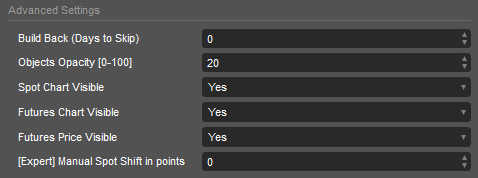
Build Back (Days to Skip) is the option to work with history data. It determines the number of days to skip from the current date and then load the required historical data using the "Days to Load" setting from the Common Settings.
Objects Opacity is a transparency of the OHLC bars from 0 to 100.
Spot Chart Visible is a visibility option for the cTrader spot chart on background. It can be changed later in the Indicator Panel.
Futures Chart Visible is a visibility option for the futures OHLC chart on foreground. It can be changed later in the Indicator Panel.
Futures Price Visible is a visibility option for the current futures price in the box on the right side of the current chart window.
[Expert] Manual Spot Shift in points sets the manual value to be used to adjust indicator data by the amount of defined points. The "0" value put the chart by the prices as they comes from the futures market.
Chart Colors
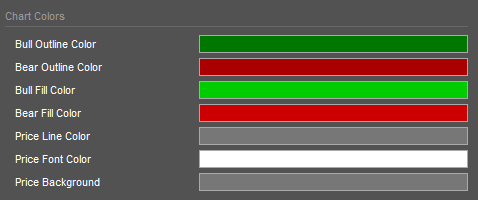
Bull Outline Color is the color of the bar borders and wicks for Bull bar (open price below close price)
Bear Outline Color is the color of the bar borders and wicks for Beal bar (open price above close price)
Bull Fill Color is the fill color of the bode of Bull Bar.
Bear Fill Color is the fill color of the bode of Beal Bar
Price Line Color is the color of the dashed line from the last candle to the futures price box
Price Font Color is the color of the text for current Futures price.
Price Background is the background of the futures price box.
Tips and Social Networks
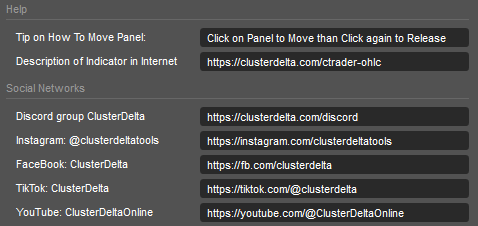
Help section is the small tip on how to move the indicator panel and the URL on where to get the full documentation about indicator
Social Networks are the links to join our Discord and follow us in the Instagram and other social networks

