
")
MetaTrader 4 / MetaTrader 5
To work comfortably with indicators, you need to do a few simple steps:
- Download indicators
- Install indicators into your MetaTrader
- Configure access for the indicators to work correctly
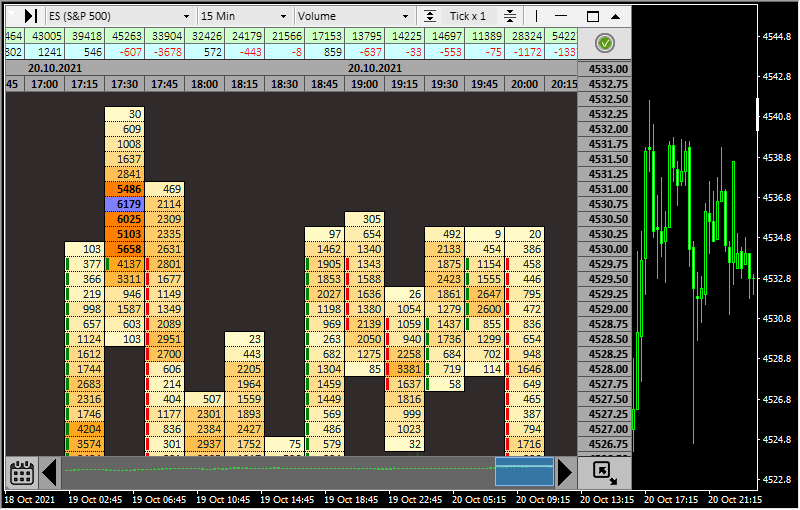
Indicator Name: ClusterDelta_#Footprint
Footprint is a type of the chart where you can see sum of the traded volumes at a specified price for a certain period. Commonly the Footprint term is used with the term Order Flow.
The #Footprint indicator allows us to see accumulation and distribution of market volumes. This gives us to conduct accurate analysis based on how the markets were traded.

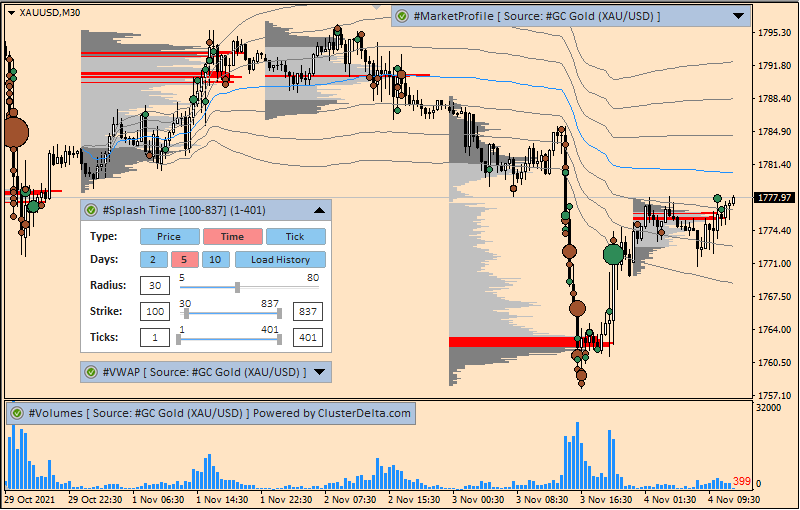
Indicator Name: ClusterDelta_#MarketProfile
The market (volume) profile shows the distribution of volumes on the prices over a certain period of time. The accumulations of volumes most often becomes support and resistance levels.
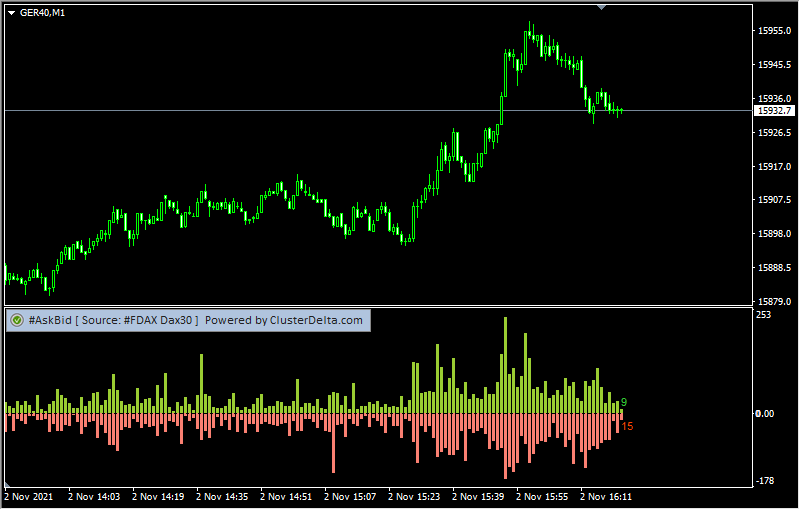
Indicator Name: ClusterDelta_#AskBid
The AskBid indicator shows the absolute values of volumes executed at the Ask prices and volumes executed at the Bid prices. Please note that volume and delta are calculated based on volumes executed at Ask and Bid prices.
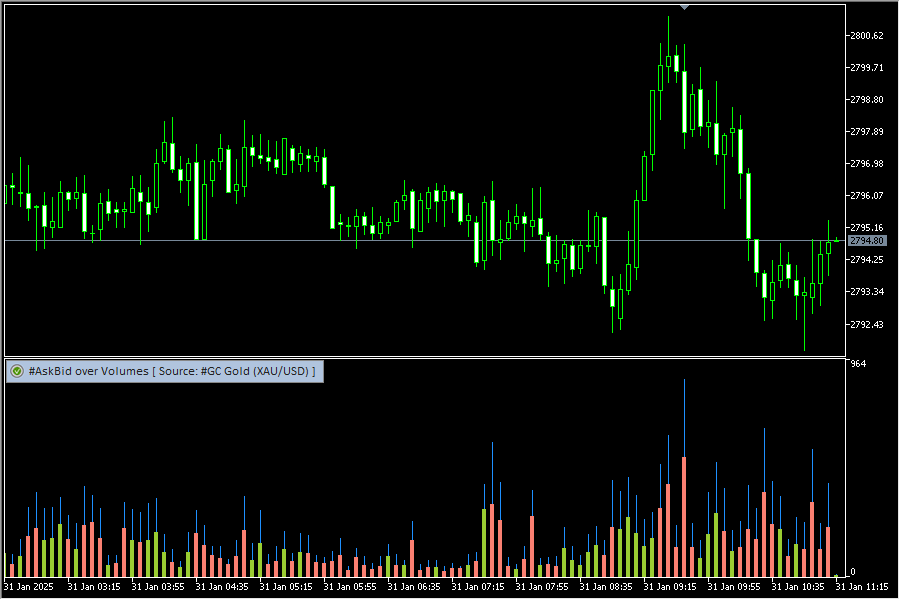
Indicator Name: ClusterDelta_#AB_over_V
This indicators provides information on the total traded volumes for each bar. Hovered layers may present the biggest value of Ask : Bid pair or the current Delta Value with different colors for the positive/negative values.
The main advantage of this indicator that user can see visual size of the partial values to the total value of Volume.
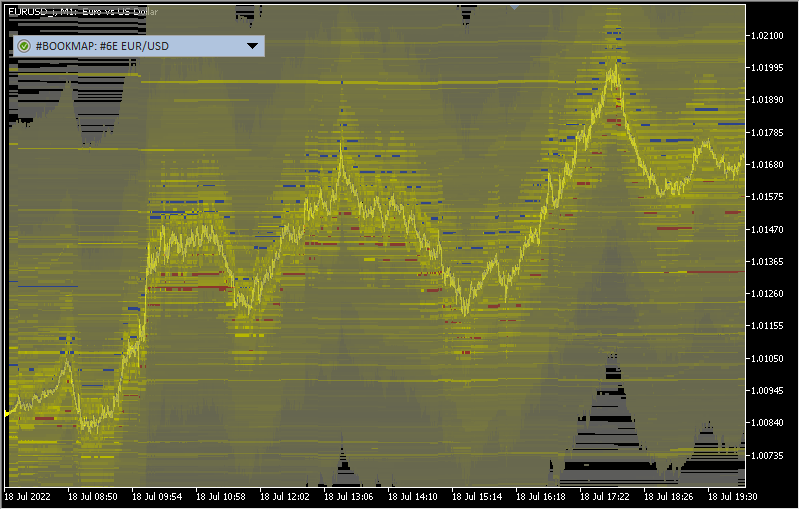
Indicator Name: ClusterDelta_#BookMap
The #BookMap indicator shows pending orders that are visible in the order book (DOM). This indicator captures the levels every minute and displays them on the screen, where the color saturation indicates relative volume.
Indicator Name: ClusterDelta_#CandlePOC
The CandlePOC indicates the price of the maximum traded volume for each candle (POC) and plots this data on the chart considering on the basis value (the difference between spot and futures). VWAP per candle is also available as an option.
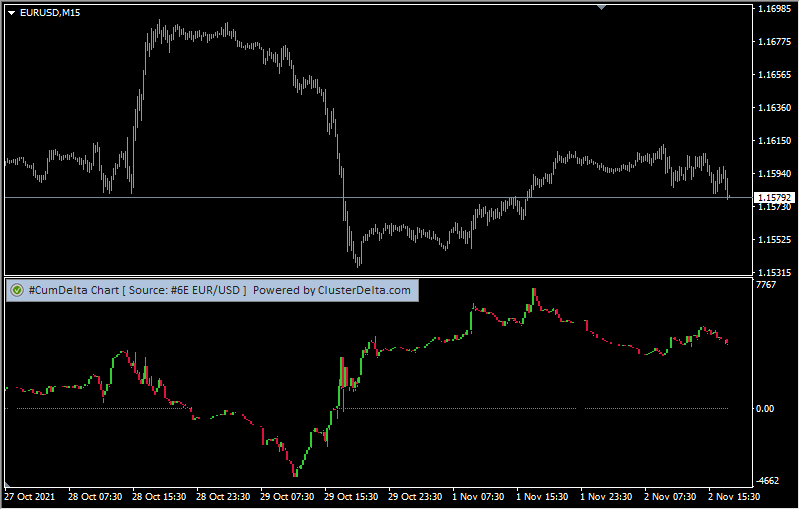
Indicator Name: ClusterDelta_#CumDelta, ClusterDelta_#CumDelta_Chart
The cumulative delta indicator shows the dynamics of delta changes over time, i.e. this indicator shows the sum of deltas from the beginning of the selected period to the current moment in cumulative mode.
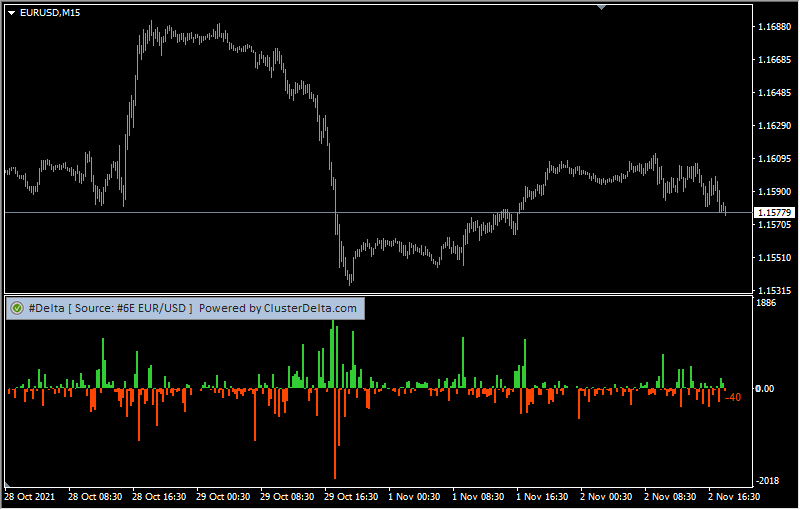
Indicator Name: ClusterDelta_#Delta
The #Delta indicator shows the difference between market buyers and sellers. The indicator shows the difference between the volume executed at the Ask prices (bearish trades) and the volume executed at the Bid prices (bearish trades).
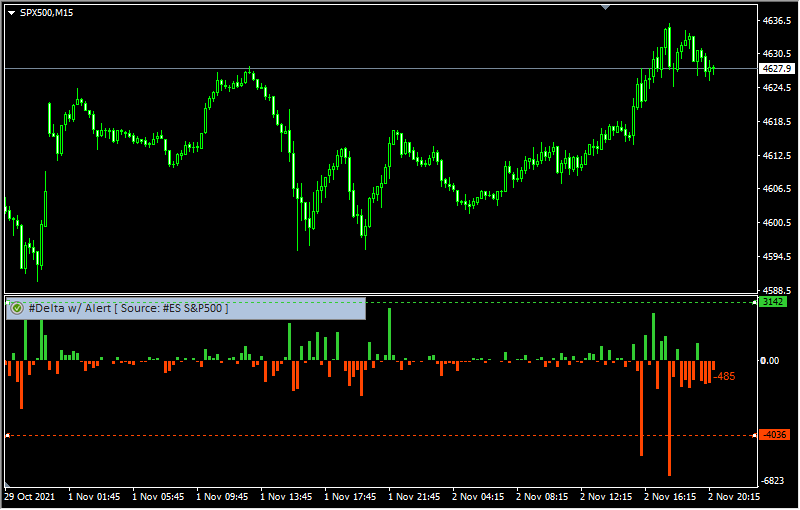
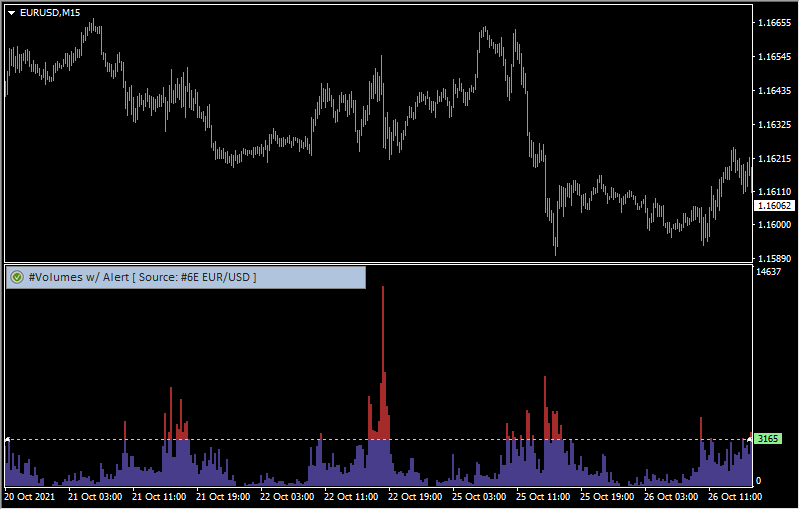
Indicator Name: ClusterDelta_#Delta_Alert
The #Delta_Alert indicator shows the difference between the volume executed at the Ask price or higher (bearish trades) and the volume executed at the Bid price or lower (bearish trades). This indicator has system of the internal sound alerts allows you to set any value for the alert, and if current delta reaches this value, a sound alert will be played.
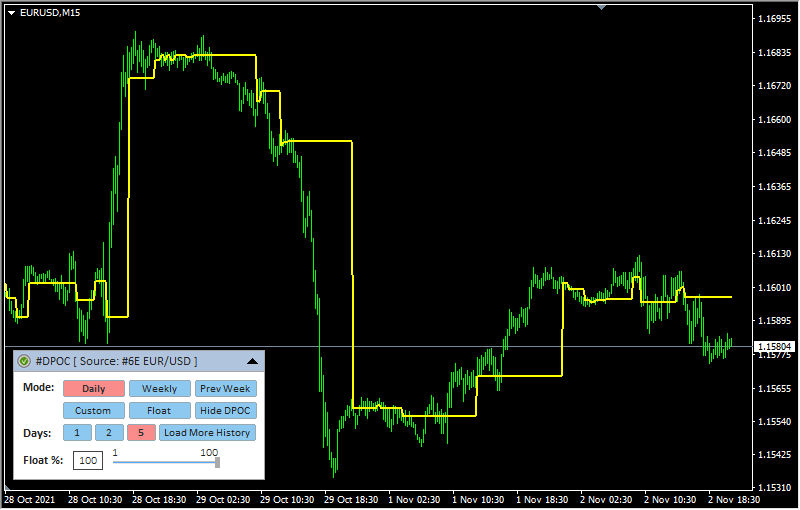
Indicator name: ClusterDelta_#DPOC
POC (Point Of Control) is the price level for the period of time where the largest amount of volumes was traded. So the price of the biggest volume in a Market Profile is POC.
DPOC (Dynamic Point of Control) is a line on a chart of how the POC moves over a period of time.
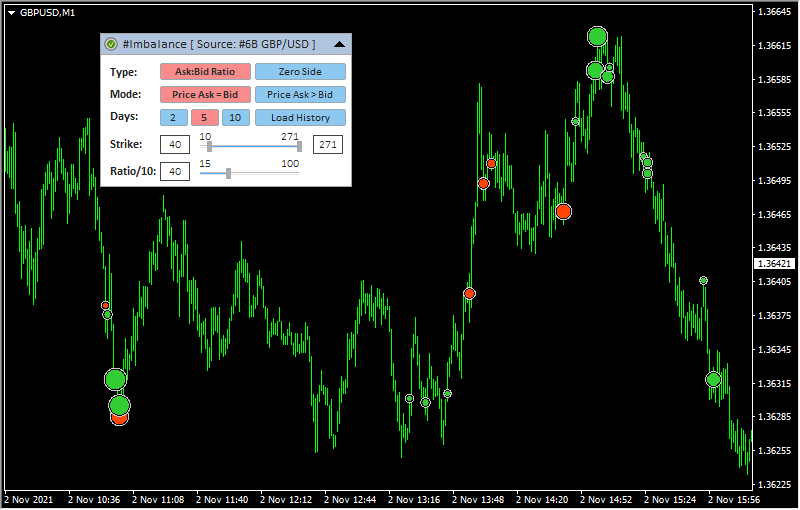
Indicator Name: ClusterDelta_#Imbalance
The #Imbalance indicator is designed to display trade imbalances in the trading process. The most common form of imbalance is a significant ratio between buyers and sellers (more than 3:1, 4:1 in any direction) or the complete absence of one of them.
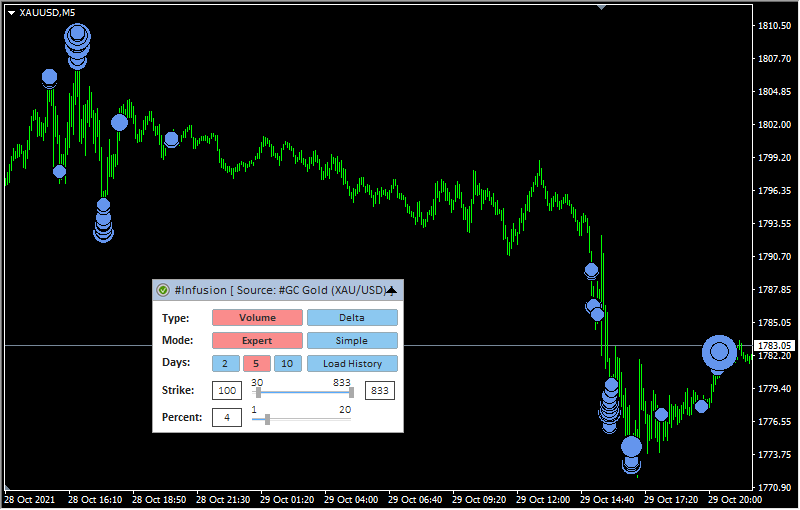
Indicator Name: ClusterDelta_#Infusion
The value of the indicator is that it can find large accumulations of volume on the current chart. For each instrument and each timeframe there is a certain volume size, after which the volume becomes "large". To find this value, indicator analyses deep history, and based on result a predictive value is formed for each next day.
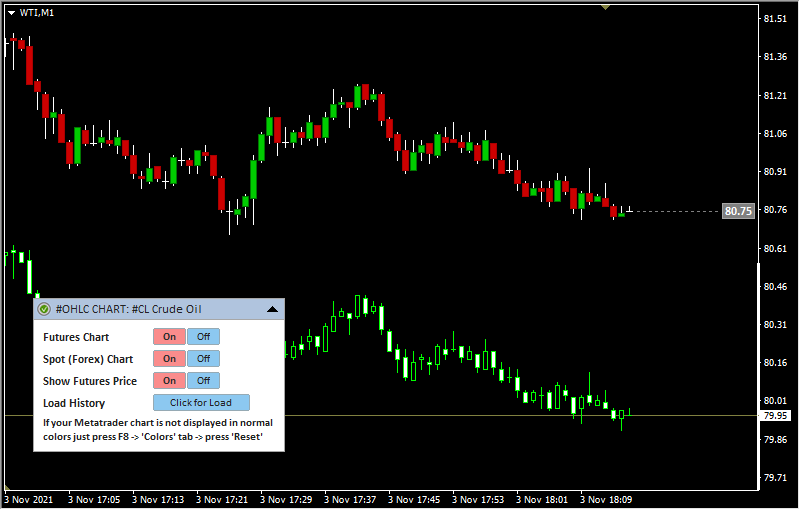
Indicator Name: ClusterDelta_#OHLC_Chart
The indicator is designed to demonstrate a futures chart over a spot chart. This will make it possible to see the correlation between the two charts, determine the value of forex_shift, or use indicators directly on the futures chart.
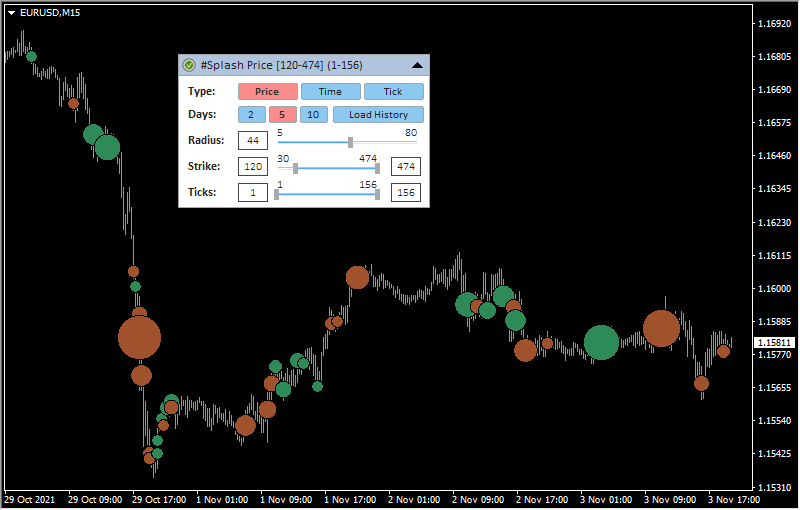
Indicator name: ClusterDelta_#Splash
The Splash indicator is the first indicator in the ClusterDelta series that deeply analyzes tick history. This indicator is designed to search for large spikes in volume, when a large amount of the volume has passed in a short period of time.
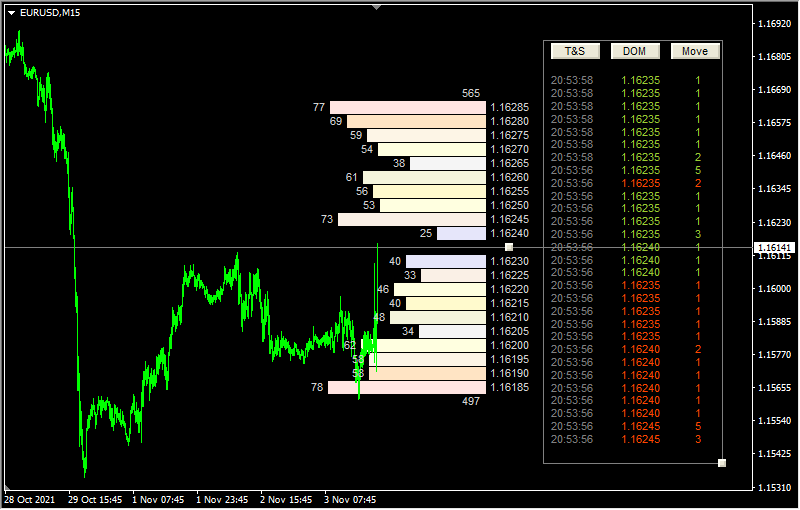
Indicator Name: ClusterDelta_#TSDOM
The #TS_DOM indicator is an indicator that displays DOM (Depth of Market) known as orders book and ticks stream also known as Time&Sales. The indicator does not accumulate data and shows the data as it comes from the exchanges. All data goes online only. Above and below the current price the total number of orders are displayed (above the price - the sell limits, and below the price - the buy limits)..
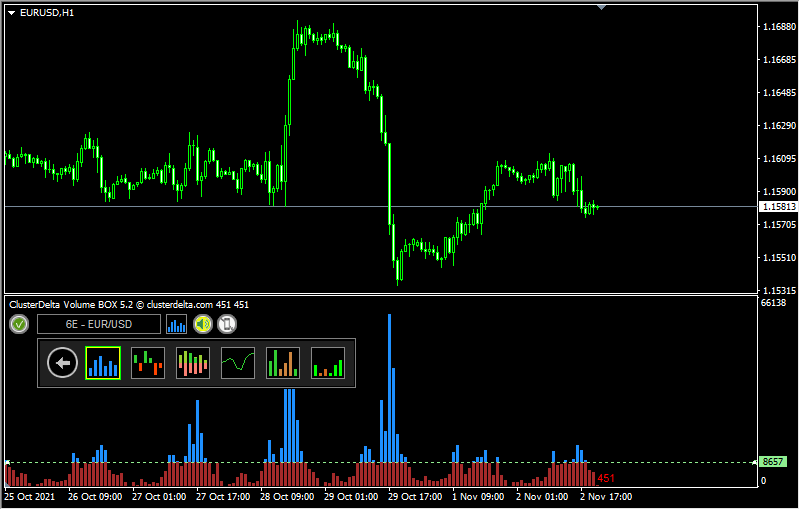
Indicator Name: ClusterDelta_#VolumeBox
The #VolumeBox indicator combines some of existing histograms, such as the histogram of volume, delta, cumulative delta and cumulative volume. The indicator has a built-in notification function and push-notifications to the phone. The indicator has a user-friendly control panel.
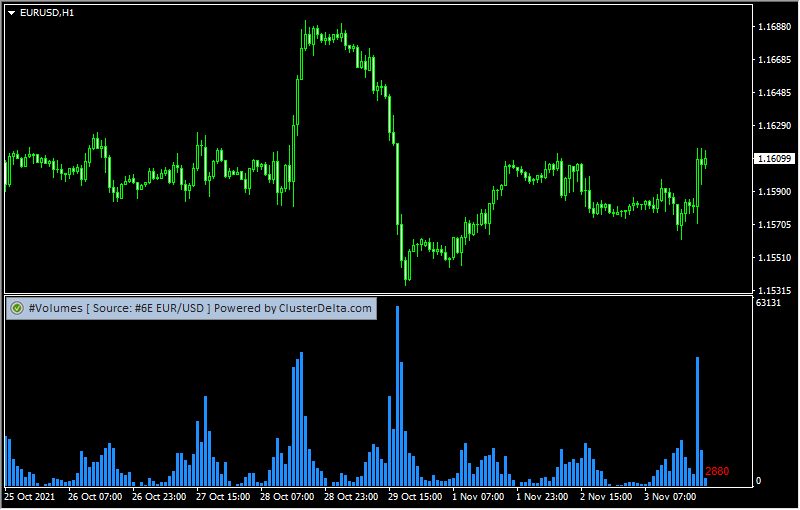
Indicator Name: ClusterDelta_#Volumes
The volume indicator provides information on the total traded volumes for each bar. Volumes information provides the real situation of market trading by showing areas of increased demand for a market instrument.
Indicator Name: ClusterDelta_#Volumes_Alert
The volume indicator provides information on the total traded volumes for each bar. Volumes information provides the real situation of market trading by showing areas of increased demand for a market instrument.
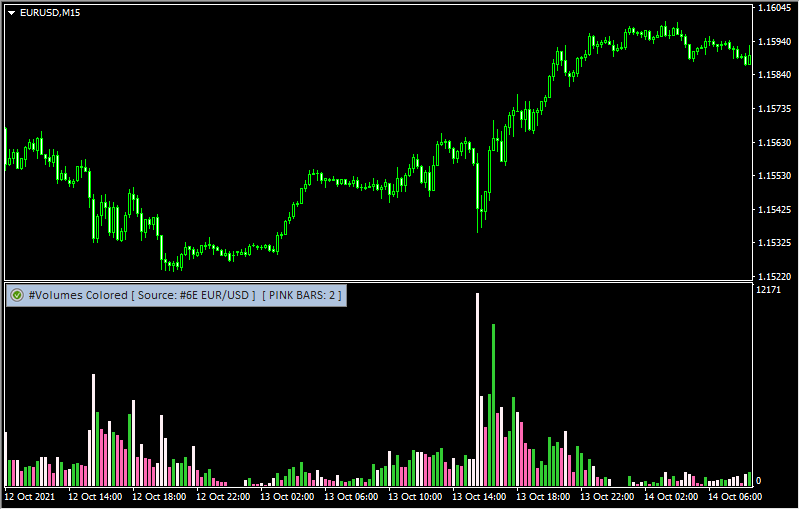
Indicator Name: ClusterDelta_#Volumes_Colored
This volume indicator provides information on the total traded volumes for each bar using specific color set that is know as "Pink Volumes".
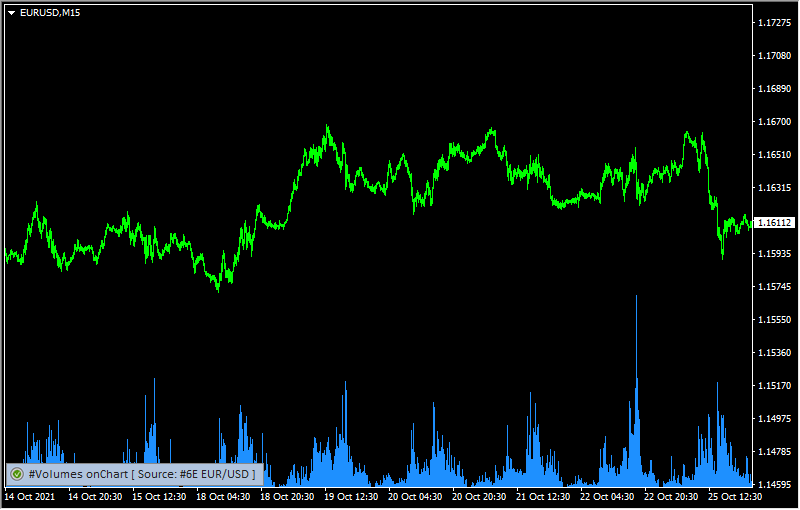
Indicator name: ClusterDelta_#Volumes_onChart
This modification puts the volume histogram at the bottom of the main chart window
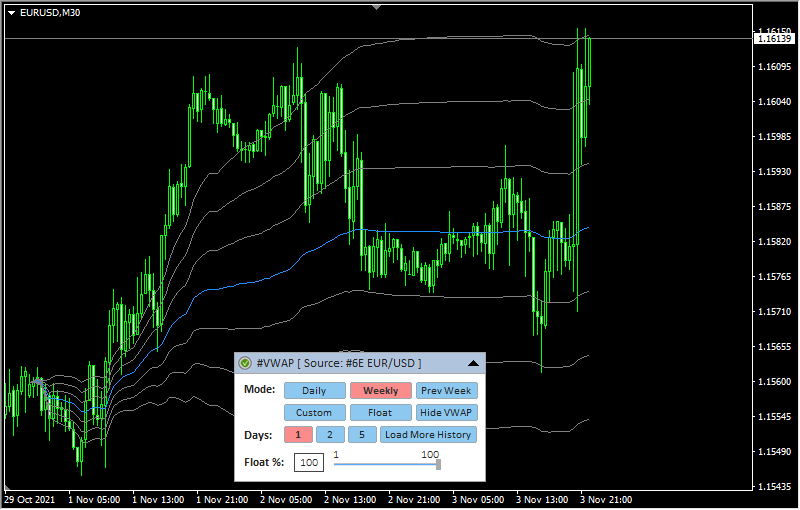
Indicator Name: ClusterDelta_#VWAP
Indicator VWAP - Volume Weighted Average Price (VWAP). In finance, volume-weighted average price (VWAP) is the ratio of the volume traded to the total volume traded over a particular time period (usually one day). It is a measure of the average price a derivative traded at over the trading period.

