
")
Indicator Name: ClusterDelta #MarketProfile
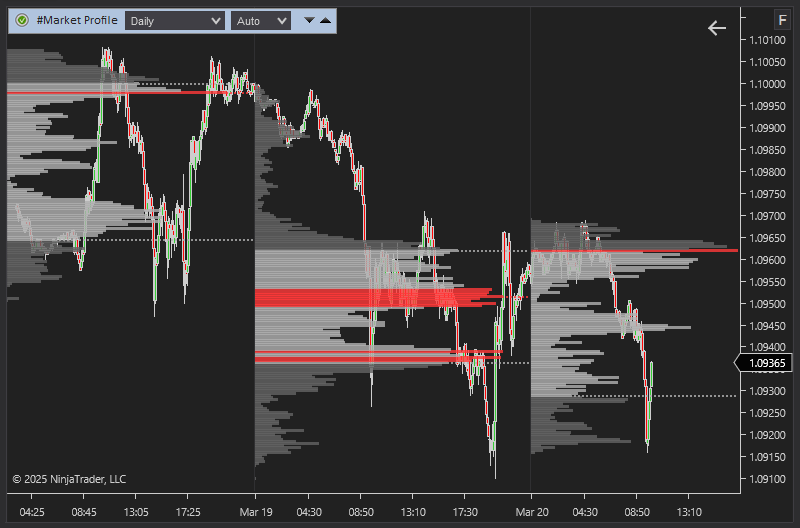
The market (volume) profile shows the distribution of volumes on the prices over a certain period of time. The accumulations of volumes most often becomes support and resistance levels.
The MarketProfile indicator allows you to build various types of profiles. In the middle of the 20th century, a technology was used in which the minimum unit for building a profile was a 30-minute candle. Modern technologies give us access to volumes in ticks, so we get the highest accuracy when constructing a profile. In the "modern" theory of volume trading, it is recommend to use volume profiles of the day (current and previous), week (current and previous), as well as the volume profile for the entire active contract.
At the time of building the volume profile, according to the market profile theory, Value Area (VA) is calculated, with its high and low prices (VAH/VAL) - the area in which 80% of the traded volume is located. When constructing a profile, we use modern knowledge in probability theory and statistics and use the first standard deviation (68.2%).
The MarketProfile indicator has been improved for use with historical data. This indicator shows not only the Market Profile, there were added some more different layers of the data.
DESCRIPTION OF THE MARKET PROFILE INDICATOR PANEL
The Title of the Market Profilepanel contains the "Authorizer" icon, the indicator name, the profile period, the number of days to load to load and display, where the value "None" removes profiles from the chart, an icon (arrow down) to open the Advanced Panel and the next icon (arrow up) to close the current Market Profile GUI panel.
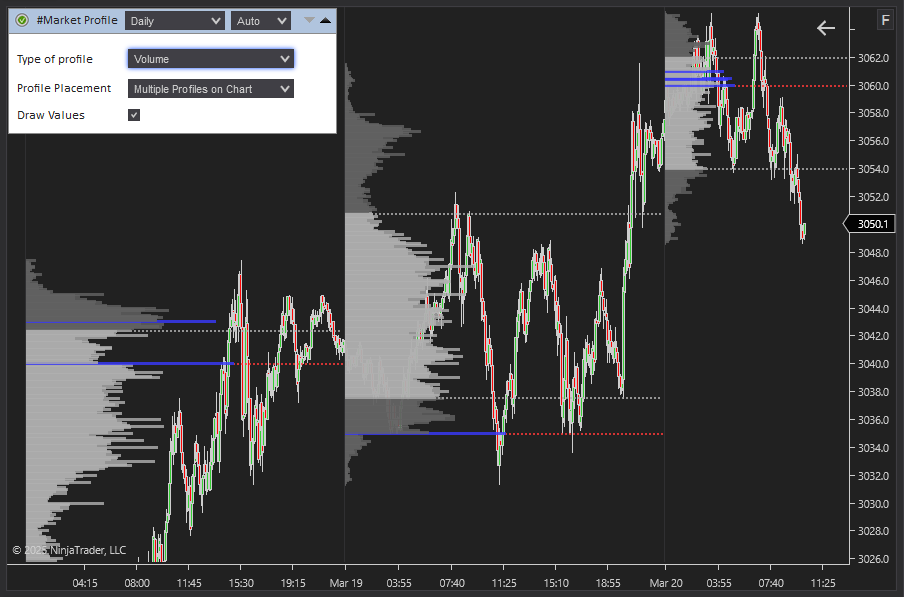
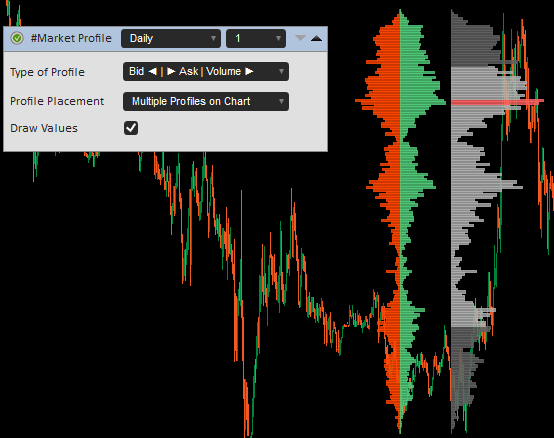
Advanced Panel has the options for the Market Profile indicator.
Type of Profile determines the type of profile. There are some predefined profiles in the list and the option for the custom profile created by a user.
Profile Placement is the position of the profile. The "Multiple Profile on Chart" allows to draw consecutive profiles. Left or Right position allows only one profile attached to the left or right edge of the chart window
Draw Values is the option to draw absolute profile values if the height of the profile line is enough to fit the text (see Min Text Size option)
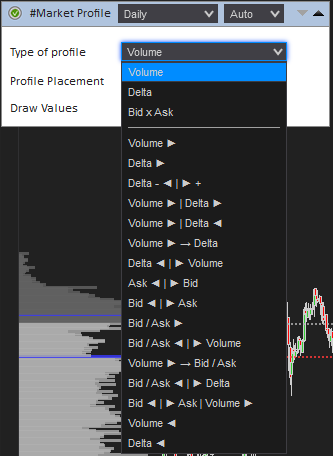
Here is the profile types. The left or right arrow defines the profile direction. The vertical line "|" means the separator between profiles. Feel free to try them all to see how it works.
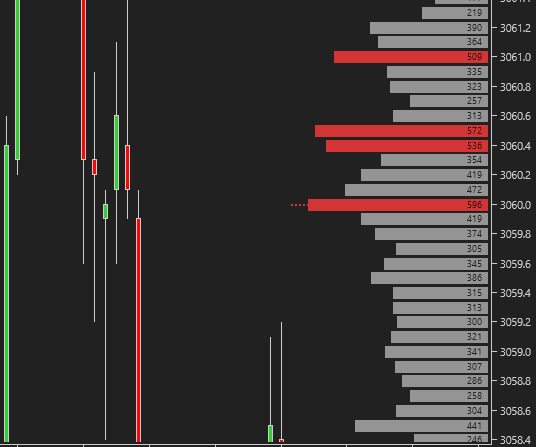
Here is a small example of the "Draw Values" option, showing how you can see the absolute values of the Market Profile if you zoom in the chart so that height of the profile line is enough to fit the text
CLUSTERDELTA MARKET PROFILE PARAMETERS DESCRIPTION
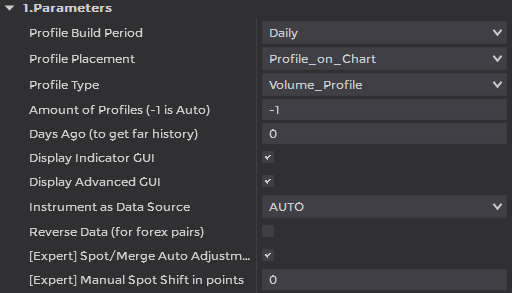
Parameters
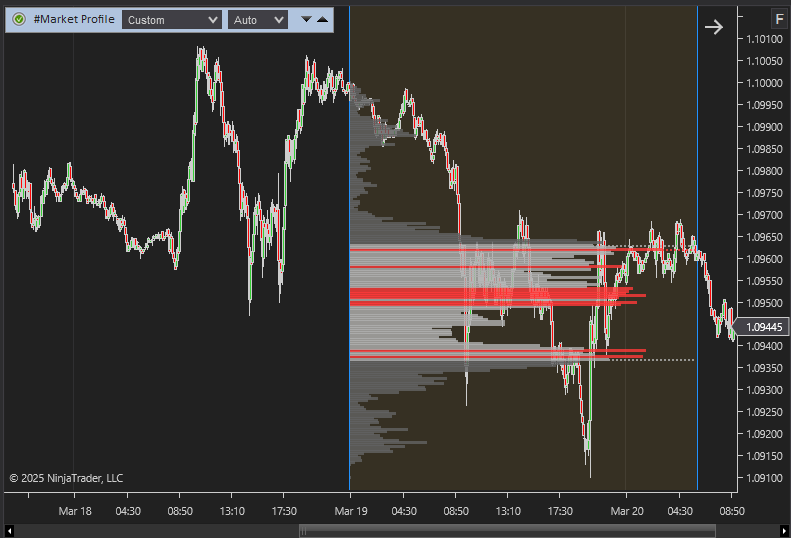
Profile Period - define time periods for building the profiles.
- Custom_Period - custom mode, when indicator data uses the period from Custom Period vertical lines on the Chart
- per_Hour - the building period is a hour
- Daily - the building period is a day (from start trading after market break)
- Weekly - the building period is a week (from start trading after market break on Monday to start break on Saturday)
- Previous_Weeks - the building period will be calculated as the entire previous week (the week is counted from Monday to Sunday)
- Globex - the building period is 01:00 - 23:59 GMT+2
- per_Asia - the building period is 00:00 - 09:00 GMT+2
- per_Europe - the building period is 09:00 - 15:00 GMT+2
- per_NYSE - the building period is 15:00 - 24:00 GMT+2
- per_CME - the building period is 16:30 - 23:30 GMT+2
- per_Contract - the building period will be defined as the entire current contract since the last rollover
Profile Placement - define the chart/window position for building the profiles.
- Profile On Chart - the profiles will be built directly on the price chart.
- Left Side Profile - the profile (one only) will be statically located on the left side of the chart window
- Right Side Profile - the profile (one only) will be statically located on the right side of the chart window
Profile Type - the predefined set of the profiles to load on startup. The full list you can see on the screen above in the GUI description section.
Amount of Profiles - the number of profiles to build in a series for the period specified in "Profile Period" option. To not overload server side do not use the big values. To get more data in history use the option "Build Back (Days to Skip)" in the Advanced settings section.
Days Ago (to get far history) is the option to work with history data. It determines the number of days to skip from the current date and then load the required historical data using the "Days to Load" setting from the Common Settings.
Display Indicator GUI is a small graphical panel containing current access status (click to open the Authorizer), name of the indicator, Splash mode and the volume size, the ticker name of the data source and the alert icon
Display Advanced GUI shows or hides the Advanced Panel on start
Instrument as Data Source - select a futures from the dropdown list as the source for data. Value AUTO causes automatic detection of the instrument using the NinjaTrader ticker.
Reverse Data is an option for reverse the indicators data (Ask ↔ Bid) for reversed currency pairs except those that have name "USDJPY", "USDCAD", "USDCHF", "USDMXN". This option was added for compatibility, but in 99.9% of NinjaTrader cases keep it turned off.
[Expert] Spot/Merge Auto Adjusting is an option that allows you to adjust DPOC data to the spot chart using the latest highs and lows of the current trading session. The difference that is automatically calculated using this option may vary from trading session to trading session, so this may result in incorrect alignment of DPOC data for different trading sessions.
[Expert] Manual Spot Shift in points sets the manual value to be used to adjust DPOC data to the spot chart. Use the middle mouse button to measure the distance in points to use this value in this option.
Settings
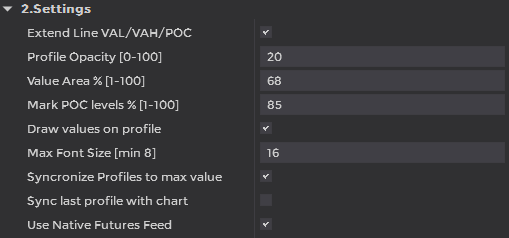
Extend Line VAL/VAH/POC is the option to make the VAL/VAH/POC continuous line until end of the profile build zone (period).
Profile Opacity [0-100] is the transparency of the lines of profiles
Value Area % [1-100] - the percentage of the Value Area to calculate VAL/VAH prices and Value Area zone 1st deviation value is 68%, in classic theory it is 80%
Mark POC levels % [1-100]. If the size of current volume is bigger than the current percentage of the biggest volume, the line will be marked with POC colors
Draw values on profile - is the option to draw absolute profile values if the height of the profile line is enough to fit the text
Max Font size [min 8] is the maximum text size that will be used to display the profile values.
Synchronize Profiles to max value is the ability for multiple profiles to use a global maximum value for all periods and scale lines based on that value (otherwise, the maximum value and scaling are done in the local profile).
Sync last profile with chart . The last profile is not complete because the period is not closed, so the profile only uses the width from the first to the last bar of the current period instead of using the full length of the entire period.
Use Native Futures Feed is the option that allows to get tick data for updating Splash data from the current feed if it is a futures feed.
Profile
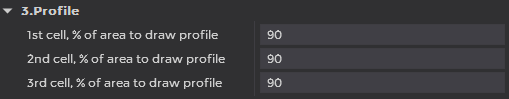
1st / 2nd / 3rd cell, % of area used to draw profile. The entire width of the available space for building profiles can be divided into up to 3 cells. Each profile can be scaled within each cell using these options. The value "90" means that the profile in the current cell will use 90% of the available width, leaving 10% empty space for better visualization.
Custom Profile
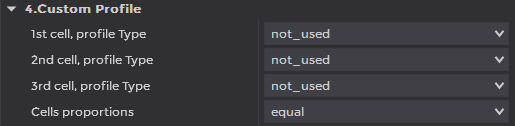
1st / 2nd / 3rd cell, Profile Type. As mentioned above, the entire width of the available space for constructing profiles can be divided into up to 3 cells. Each cell can be used by an available profile type (Left, Right are the direction of the profile lines).
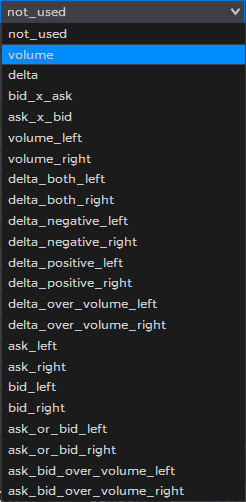
- Volume data is used for volume profile
- Deta data is used for delta profile that uses different directions for positive and negative values
- Bid x Ask , Ask x Bid data is used for Ask/Bid profile that uses different directions for Ask and Bid values
- Ask data is used for profile
- Bid data is used for profile
- Ask or Bid uses only the larger value for profile
- Ask or Bid over Volumes uses only the larger value of Ask:Bid pair that will be above the volume profile
- Delta both uses both, delta positive and negative values
- Delta negative uses only the delta negative values
- Delta Positive uses only the delta positive values
- Delta Over Volume uses the volume profile first and delta values above the volume profile
Cell Proportions is an option that allows you to make the width of cells equal or increase the width of one cell compared to the others.
Cell #1: Bid Left, Cell #2: Ask Right, Cell 3: Volume Right, Cell Proportions: Last cell is bigger
Custom Range Visualization
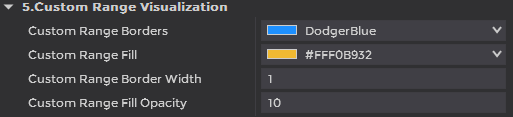
Custom range is the option to build profile using any start and end time defined by two vertical lies on chart. The custom zone is highlighted by Custom Range Fill color, The lines color is Custom Range Borders with the properties of thickness defined by Custom Range Border Width with transparency defined by the Custom Range Fill Opacity option.
Profile Colors
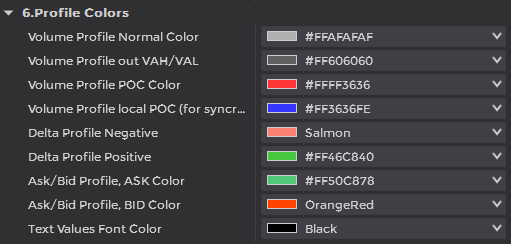
Volume Profile Normal Color is the lines color inside Value Area
Volume Profile out VAH/VAL is the lines color outside Value Area
Volume Profile POC Color is the lines color of the largest values in profile
Volume Profile local POC Color is the color of the lines of the largest values inside the local profile, if the maximum volumes are less than the global maximum value and the “Synchronize profile with maximum value” option is enabled.
Delta Profile Negative is a color of the profile lines of the delta profile, negative values only
Delta Profile Positive is a color of the profile lines of the delta profile, positive values only
Ask/Bid Profile, ASK Color is a color of Ask or Ask/Bid profile lines, only for Ask values
Ask/Bid Profile, BID Color is color of Ask or Ask/Bid profile lines, only for Bid values<
Text Values Font Color is a color for text that represents profile values
Join us on ClusterDelta Discord channel and follow us in the Instagram: @clusterdeltatools

