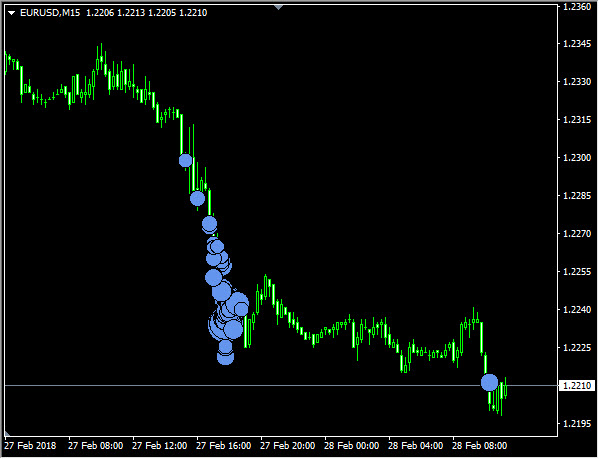
Indicator Name: ClusterDelta_#Infusion
The value of the indicator is that it can find large accumulations of volume on the current chart. For each instrument and each timeframe there is a certain volume size, after which the volume becomes "large". To find this value, indicator analyses deep history, and based on result a predictive value is formed for each next day.
The Infusion indicator is not only an indicator, but already a kind of self-adapting analytical module for searching for large volumes.
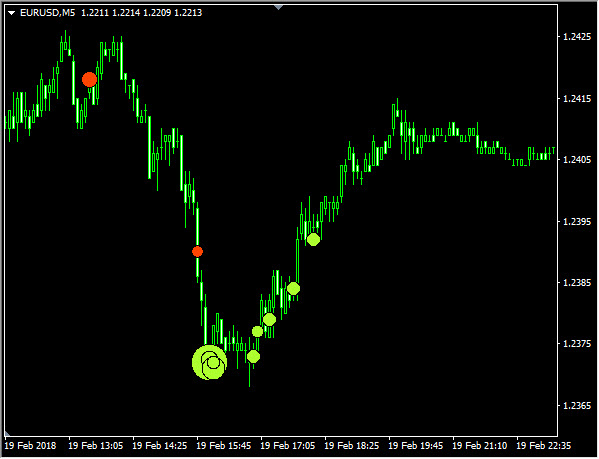
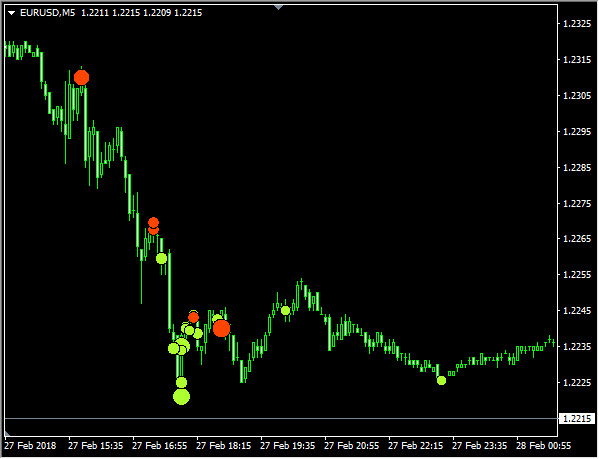
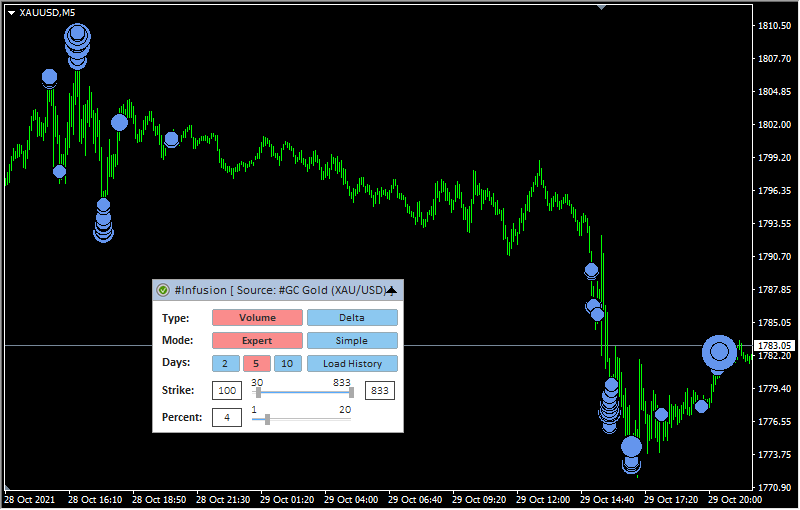
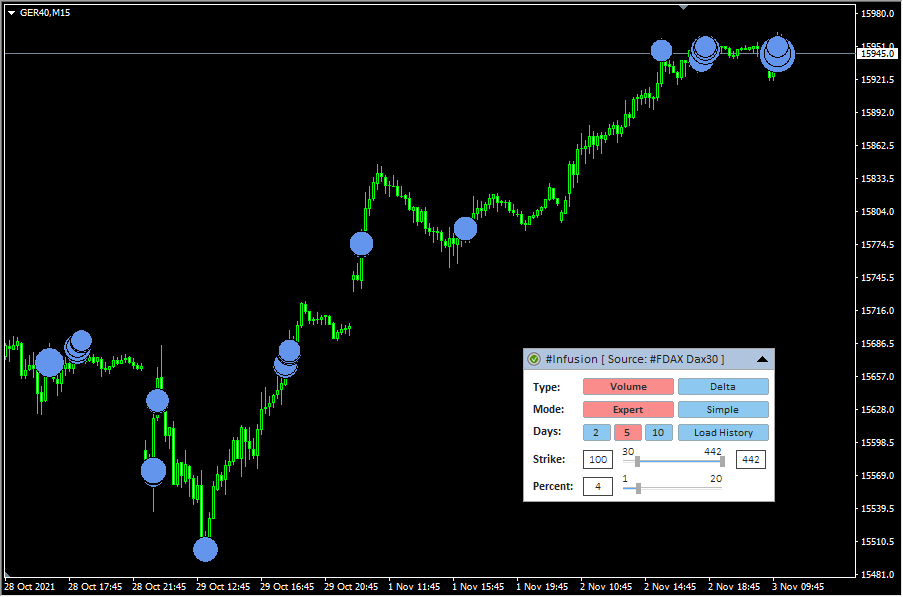
Big volumes are the stimulators of the market, the market is pushed by volumes and where they "appear" the market reacts in its own way. Big volume can push the market as well as they can stop it. Also, the interesting fact about this indicator is that in addition to analyzing the large volumes, it can indicate extreme delta values, which show an imbalance between buyers and sellers in the market.
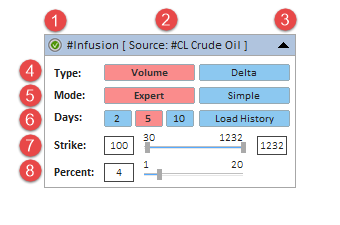
Description of graphic panel:
-
1 - authorization status (for more details on authorization, see the How to install and use indicators section)
2 - the name of the indicator and the instrument - the data source. Using Drag & Drop, you can move the panel along the chart (to activate the panel, you may need to double-click the mouse)
3 - the icon to Expand/Collapse graphic panel
4 (Type) - indicator building mode corresponding to the Type_Data input parameter. Volumes - the indicator will analyze the peak volumes. Delta - the indicator will analyze the peak delta (the difference between ask and bid)
5 (Mode) - indicator building mode corresponding to the Calculate_Mode input parameter. Expert - the indicator will do an expert search for critical volume values by analyzing the history for the last two weeks, taking into account that the total percentage of the sum of volumes should not exceed the Percent_Of_Total_DayVolume parameter (which can be changed in the graphical panel in item # 8 - Percent). Simple - the indicator do not make any analysis, any just shows on the chart all objects in which the size of the accumulated volume will be within the values specified in the Min_Strike, Max_Strike parameters (that can be changed in the graphical panel in paragraph # 7 - Strike)
6 (Days) - the number of days to build the indicator corresponding to the History_In_Days input parameter. The value defines the number of days to display accumulations. The "0" value removes all infusion objects from the chart. The "Load More History" button additionally loads the current amount of history (in days).
7 (Strike) - the range of volume values that is used to plot on the chart. The minimum value is defined by the The Lowest Strike Value parameter; to optimize the load, the minimum accumulation value is set at 20 lots. The maximum is defined on the actual data. In the graphical panel, the current values can be changed with the slider or by editing the value in the text fields.
8 (Percent) - for expert mode this parameter changes the corresponding value of the Percent_Of_Total_DayVolume parameter. The concept is based on the fact that the instrument is traded within a certain volume value from day to day. To define the threshold value for large volumes indicator calculates the total amount of the maximum accumulations in a such way that it does not exceed the specified percentage per day. Then the data are averaged over two weeks in history and a new value is formed for each next Day. The larger the percentage of the total volume, the smaller the threshold value will be. To change the Percent parameter, you need to move the slider or change its value in the text field. After changing the value of this parameter, an additional button will appear to the right of the slider with a new value and a "?" - as a proposal to change the parameter. To apply a new value, click on this button (when you hover the mouse over the button, the "?" Sign will change to "!").
You can hide the panel completely from the screen with the "Z" key and show it again with "X" key.
The F5 button allows you to reinitialize the coordinates of the panel based on the current size of the chart window (it helps if the panel has disappeared from the workspace). Please note that resetting coordinates will not display the panel that is already hidden by the Z button or by the input "GUI" parameter.
When adding an indicator to a chart, priority is given to the input parameters. However, after making changes to the settings through the graphic panel, the indicator takes the current parameters from the graphic panel when the timeframe changes. In some cases, removing and re-attaching an indicator will help to solve a specific problem.
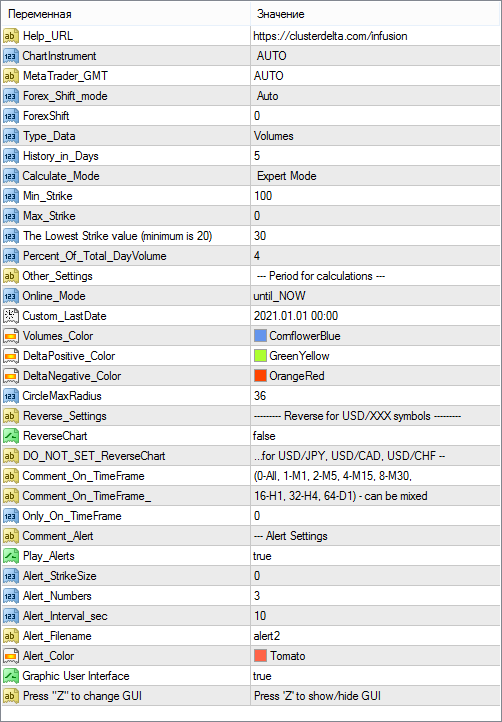
Description of indicator inputs:
- HELP_URL - this is the URL where you can get the full description of the indicator.
- Select Futures from List - select a futures from the dropdown list as the source for data. Value Auto Select causes automatic detection of the instrument by the MT ticker.
- MetaTrader_GMT - the GMT value of your Metatrader. In 95% of cases leave AUTO.
- Forex_Shift_mode - defines a method for calculating the difference in the prices between futures and forex.
Possible values of the Forex_Shift_mode:
- Auto - the offset will be calculated based on the "High" and "Low" prices of the forex and futures bar.
- Manual - the offset will be set manually via the Forex_Shift variable
- Forex_Shift - the number of points by which the indicator data will move up or down if the Forex_Shift_mode parameter is set to "Manual". This variable can be either greater than or less than zero. It is intended to take into account the forward points (the difference between the prices of the futures and the forex/spot).
- Type_Data - selection the type of the source for calculating and plotting infusion data.
The possible values of Type_Data:
- Volumes - the data source for calculations is a volume (the sum of the trades executed at the ASK price and the BID price)
- Delta - the data source for calculations is a delta (the difference of the trades executed at the ASK price and the BID price)
- History_in_Days - the number of days to plotting data.
- Calculate_Mode - selection of a method for calculating and plotting the data
The possible values of Calculate_Mode:
- Simple_Mode - no calculations and analytics in this mode. It displays all data whose volume or absolute value of delta (the source is set in the Source_Data parameter) is greater than the value of the Strike parameter.
- Expert_Mode - the adaptive value is calculated based on the Percent_Of_Total_DayVolume parameters (the description of the calculation is given under the description of the indicator parameters).
- Min_Strike - if the Calculate_Mode parameter is set to Simple_Mode, the Strike parameter sets the threshold above which the calculated data (volume or delta in the Source_Data) will be displayed.
- Max_Strike - if the Calculate_Mode parameter is set to the Simple_Mode value, the Strike parameter sets the maximum value for the data that will be displayed on the screen. If the value is "0", the maximum value will be found from the loaded data.
- LowLevelStrike (default value is "20") - the minimum value of the size of the accumulation of volumes to download from the server to optimize the load when working with the graphical panel
- Percent_Of_Total_DayVolume - Percentage of the total volumes of the trading session to calculate the critical value above the which, the data will be a target for indicator. The range of values is from 1 to 20, the recommended values depending on the instrument are from 4 to 12.
- Online_Mode (default value is "until_NOW") - defines how to load data
- until_NOW - load data until the current moment
- until_CustomLastDate - load data until time defined in Custom_LastDate
- Custom_LastDate - defines the end datetime to load data if the Online_Mode parameter is set to "until_CustomLastDate".
- Volumes_Color - sets the color for displaying infusion objects in volume mode (Source_Data = "Volume")
- DeltaPositive_Color - sets the color for displaying infusion objects in delta mode (Source_Data = "Delta") for positive delta values.
- DeltaNegative_Color - sets the color for displaying infusion objects in delta mode (Source_Data = "Delta") for negative delta values.
- CircleMaxRadius - maximum circle radius that will be used to scale objects based on the data values.
- ReverseChart - for reverse currency pairs with names that differ from "USD/JPY", "USD/CAD", "USD/CHF", the value must be "true" to flip indicator data according to the direction of the price chart
- DO_NOT_SET_ReverseChart (for"...for USD/JPY, USD/CAD, USD/CHF --") - the comment in the inputs about the information describe above
- Comment_Alert - just a text comment describing the parameters below
- Play_Alerts - use "true" if you want the indicator plays sound notifications when the new infusion object appears.
- Push_Alerts - use "true" if you want the indicator send push notification to your mobile (that is connected by MetaQuotes ID in the MT options) when the new infusion object appears.
- Alert_StrikeSize - the size of the value after that the sound alert will be played. If the value is "0", it determines automatically based on the current parameters.
- Alert_Numbers - the number of times to play the alert if it triggered.
- Alert_Interval_sec - interval (in seconds) between alert plays
- Alert_Filename - the name of the file to play (the .wav files are located in the МТ \ Sounds folder, you do not need to specify the .wav extension) if alert is triggered
- Alert_Color - color text of alert message
- GUI - flag indicating the need to draw a graphical user interface (control panel)
- GUI_Hint - usage of hot keys. Press 'Z' to hide / 'X' to show GUI
The general concept of calculation: the server loads the cluster data based on the current timeframe, the number of days + an additional two weeks and starts calculating the threshold value as follows: every day, all cluster values are sorted in descending order of volume and the threshold value is lowered until the sum of all volumes (higher the threshold value) will not exceed the specified percentage of the total volume for the day (Total volume for the day * Percent_Of_Total_DayVolume / 100). During the calculation the threshold values are averaged for 2 weeks period to obtain a predictive value for the next day.
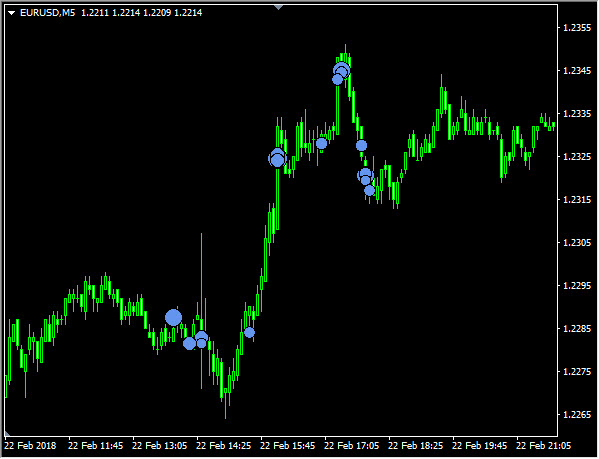
Below are the charts taken for one day at different times. As you can see on the screen, we can visually see large volumes.
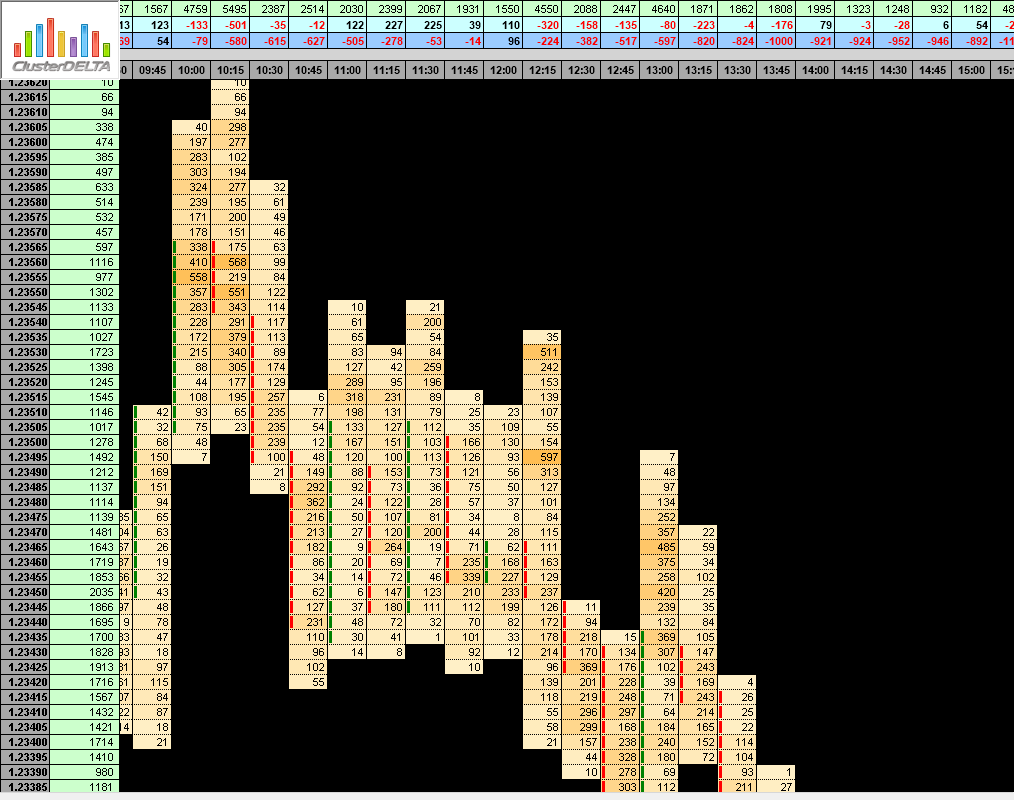
The threshold value is around 400
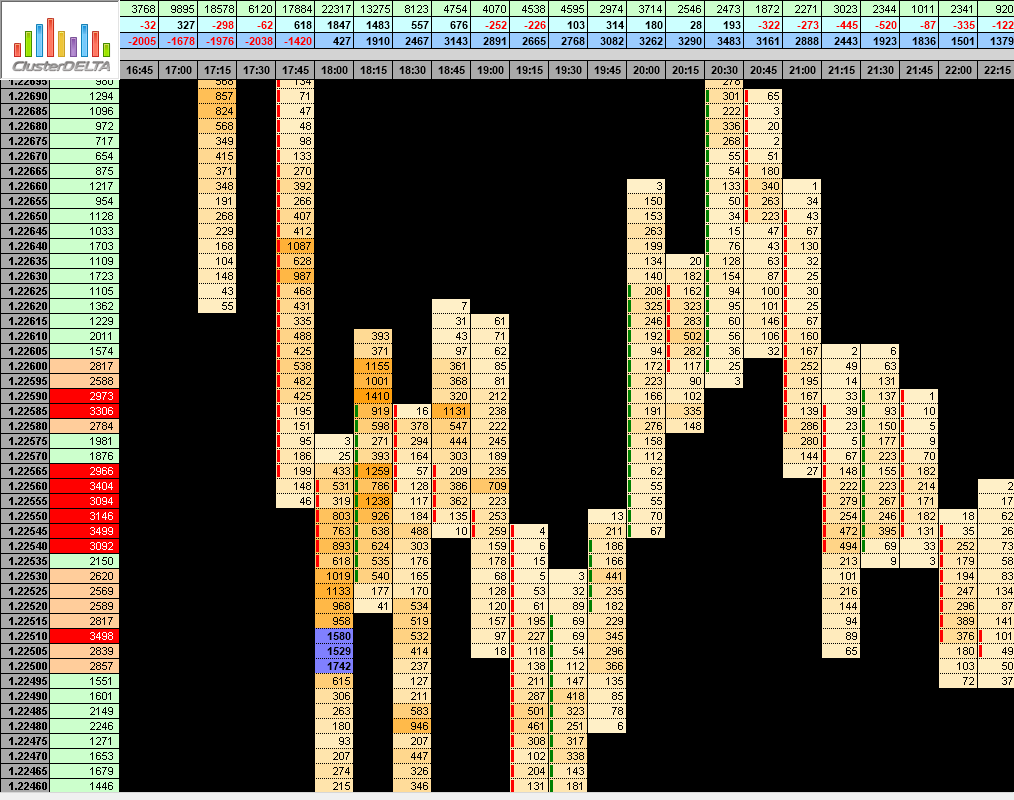
The threshold value is around 800
Also below we will give examples of how the indicator looks in the same places on the chart with different data sources.
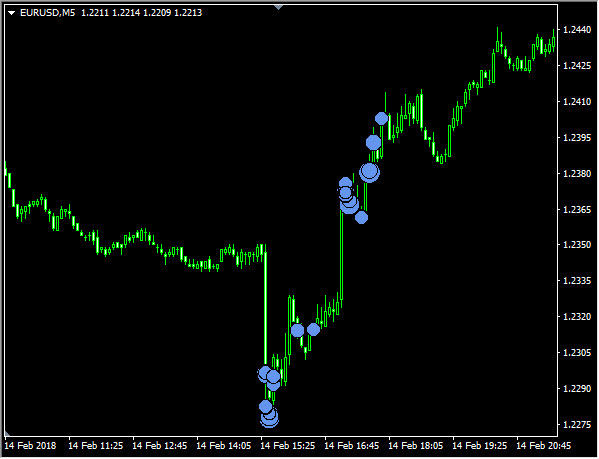
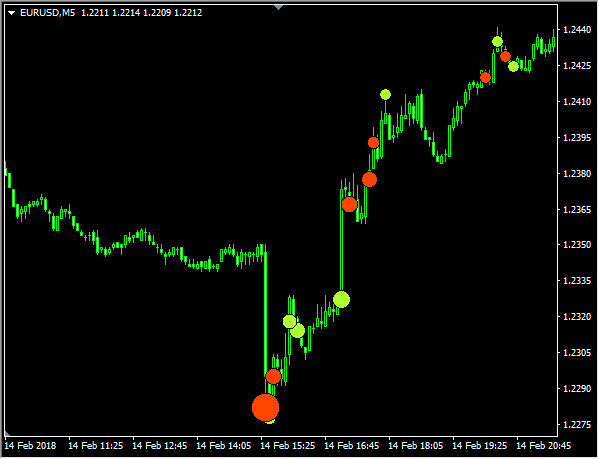
and just other chart segments (always pay attention to multiple volume accumulations)
