
")
cTrader Indicators
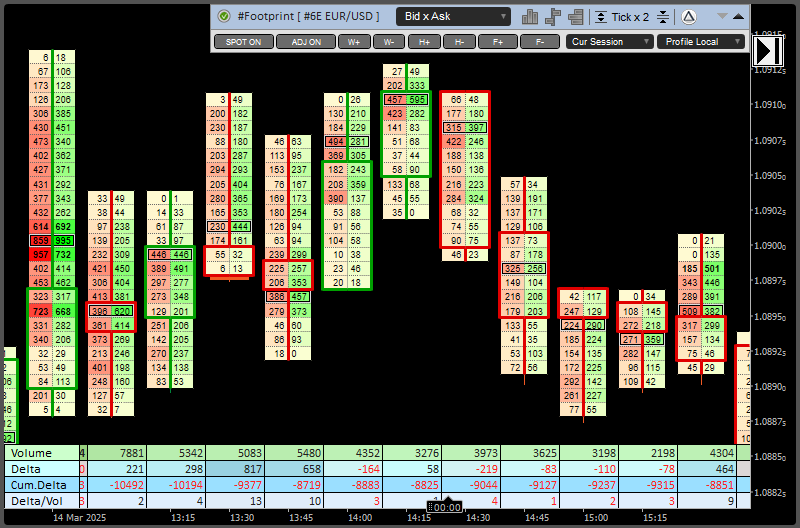
Indicator Name: ClusterDelta Footprint
Footprint is a type of the chart where you can see sum of the traded volumes at a specified price for a certain period. Commonly the Footprint term is used with the term Order Flow.
The #Footprint indicator allows us to see accumulation and distribution of market volumes. This gives us to conduct accurate analysis based on how the markets were traded.
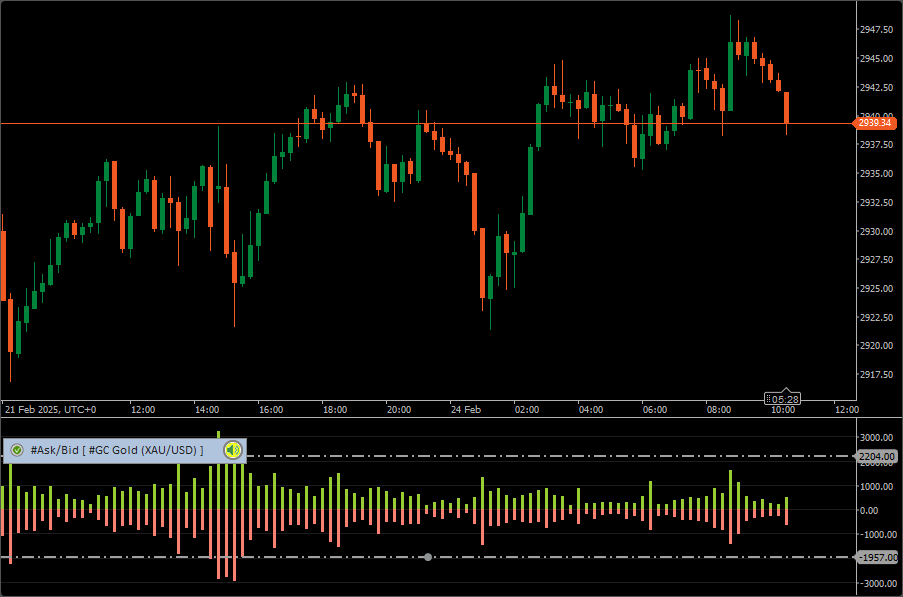
Indicator Name: ClusterDelta AskBid
The AskBid indicator shows the absolute values of volumes executed at the Ask prices and volumes executed at the Bid prices. Please note that volume and delta are calculated based on volumes executed at Ask and Bid prices.
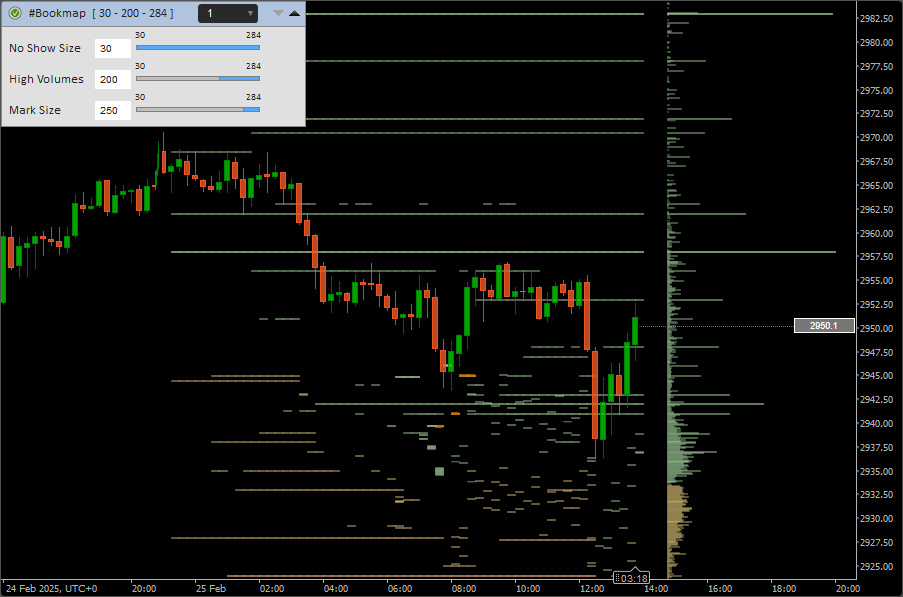
Indicator Name: ClusterDelta Bookmap
The #BookMap indicator shows pending orders that are visible in the order book (DOM). This indicator captures the levels every minute and displays them on the screen, where the color saturation indicates relative volume.

Indicator Name: ClusterDelta CumDelta, ClusterDelta CumD Chart
The cumulative delta indicator shows the dynamics of delta changes over time, i.e. this indicator shows the sum of deltas from the beginning of the selected period to the current moment in cumulative mode.
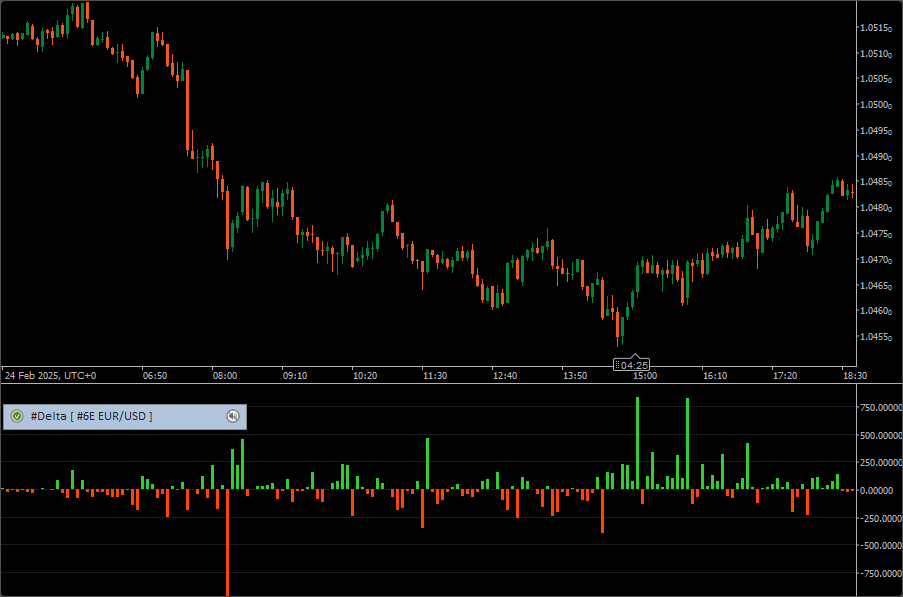
Indicator Name: ClusterDelta Delta
The Delta indicator shows the difference between market buyers and sellers. The indicator shows the difference between the volume executed at the Ask prices (bearish trades) and the volume executed at the Bid prices (bearish trades).
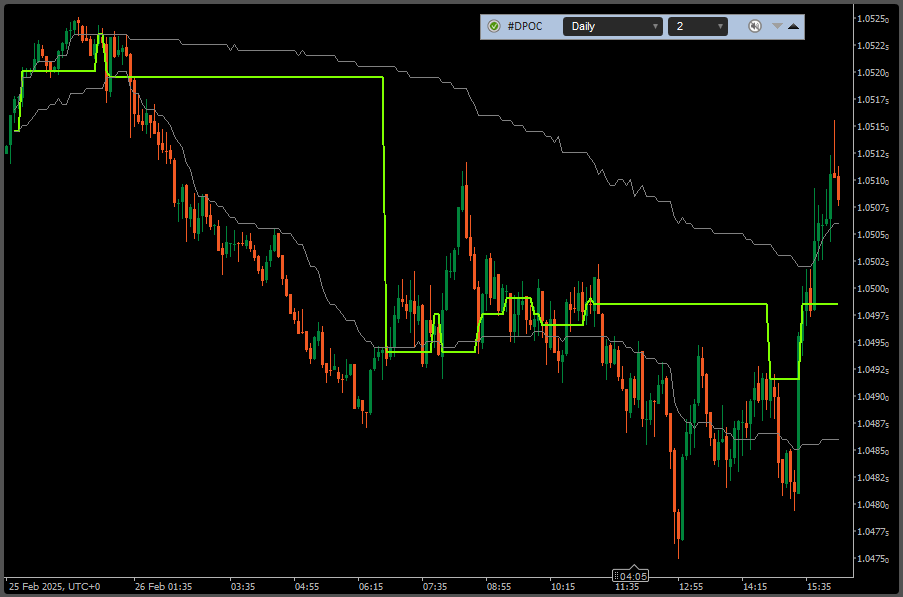
Indicator name: ClusterDelta DPOC
POC (Point Of Control) is the price level for the period of time where the largest amount of volumes was traded. So the price of the biggest volume in a Market Profile is POC.
DPOC (Dynamic Point of Control) is a line on a chart of how the POC moves over a period of time.
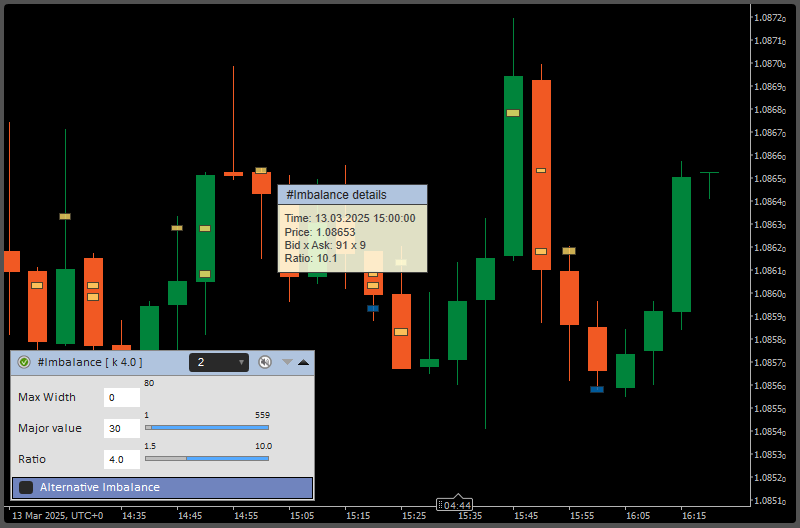
Indicator Name: ClusterDelta Imbalance
The Imbalance indicator is designed to display trade imbalances in the trading process. The most common form of imbalance is a significant ratio between buyers and sellers (Ask:Bid) or the complete absence of one of them.
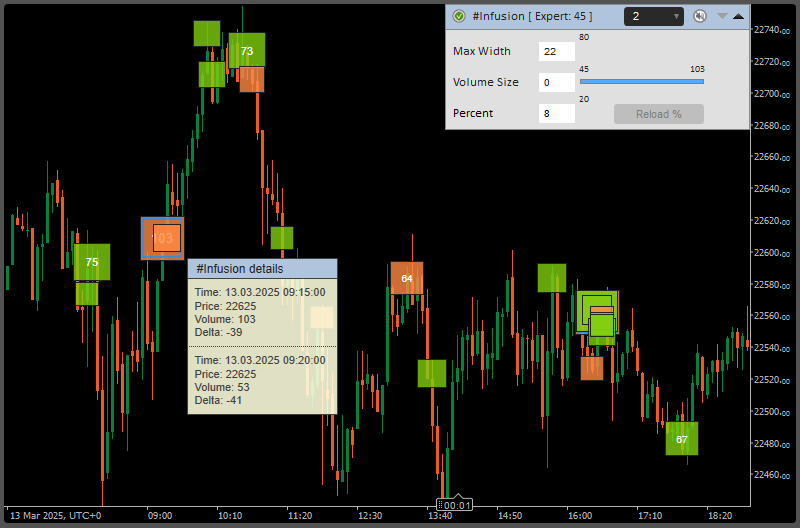
Indicator Name: ClusterDelta Infusion
The value of the indicator is that it can find large accumulations of volume on the current chart. For each instrument and each timeframe there is a certain volume size, after which the volume becomes "large". To find this value, indicator analyses deep history, and based on result a predictive value is formed for each next day.
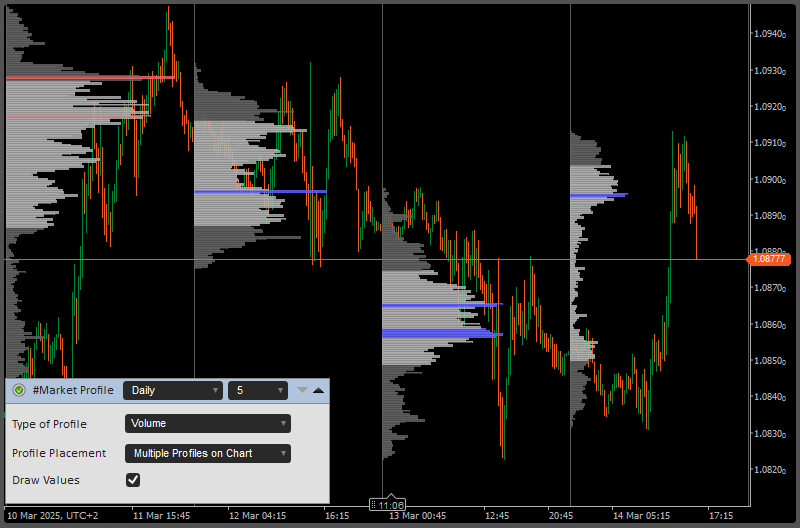
Indicator Name: ClusterDelta MarketProfile
The market (volume) profile shows the distribution of volumes on the prices over a certain period of time. The accumulations of volumes most often becomes support and resistance levels.
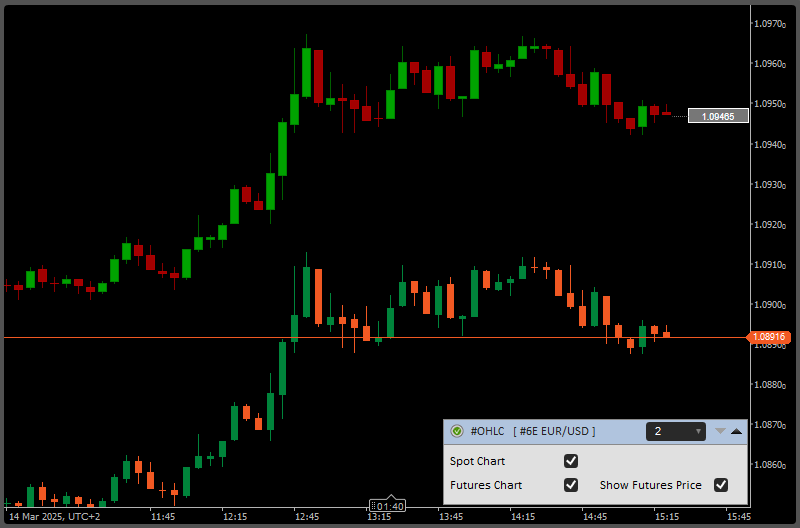
Indicator Name: ClusterDelta OHLC Chart
The indicator is designed to demonstrate a futures chart over a spot chart. This will make it possible to see the correlation between the two charts, determine the value of Manual Shift point, or use indicators directly on the futures chart.
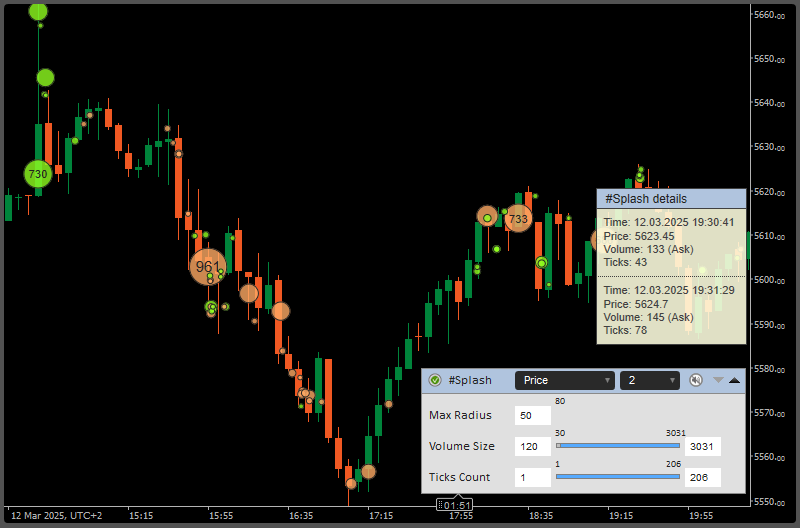
Indicator name: ClusterDelta Splash
The Splash indicator is the first indicator in the ClusterDelta series that deeply analyzes tick history. This indicator is designed to search for large spikes in volume, when a large amount of the volume has passed in a short period of time.
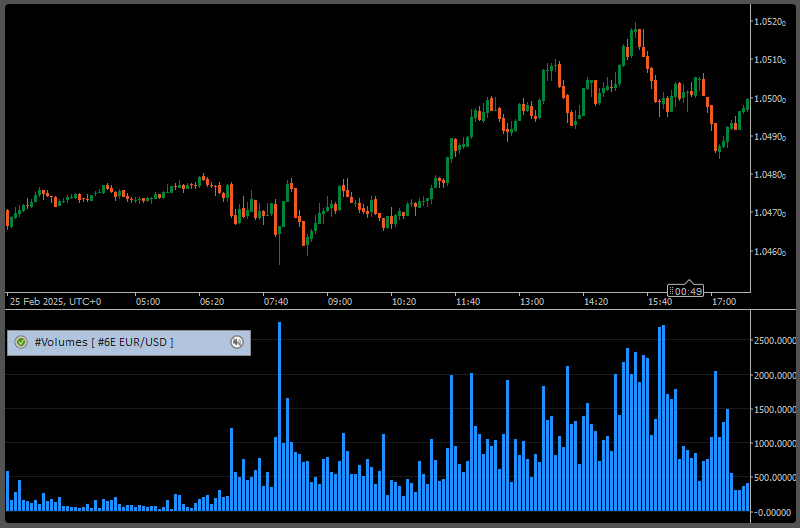
Indicator name: ClusterDelta Volumes
The volume indicator provides information on the total traded volumes for each bar. Volumes information provides the real situation of market trading by showing areas of increased demand for a market instrument.
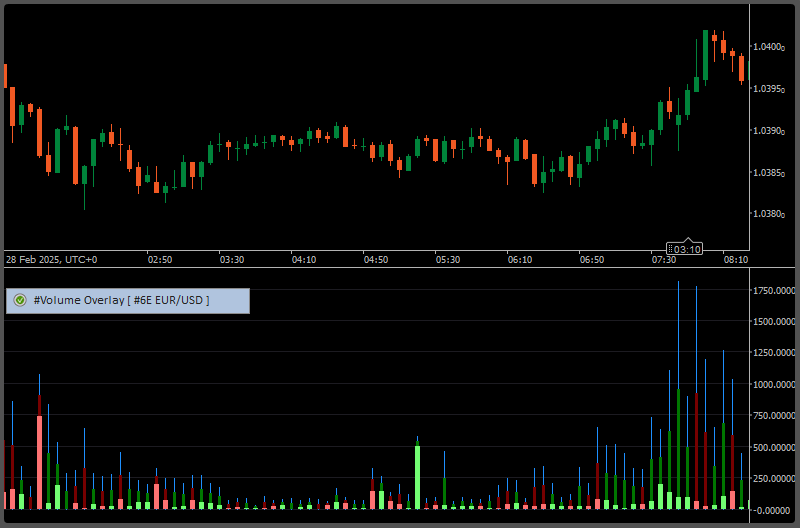
Indicator name: ClusterDelta Volume Overlay Data
The current indicator is designed to see Volume/Delta/Ask/Bid values and their relations of the absolute values in a histogram mode. So, the Volumes are at the background and Ask/Bid, Delta are above it.
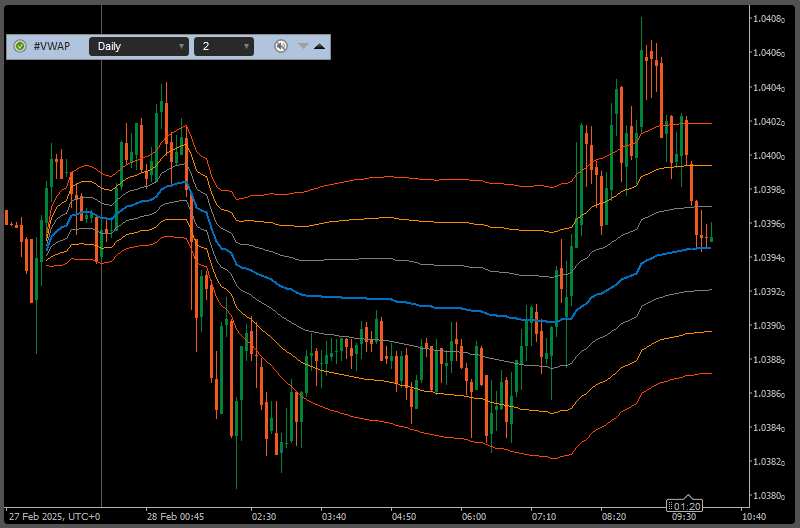
Indicator name: ClusterDelta VWAP
Indicator VWAP - Volume Weighted Average Price (VWAP). In finance, volume-weighted average price (VWAP) is the ratio of the volume traded to the total volume traded over a particular time period (usually one day). It is a measure of the average price a derivative traded at over the trading period.

