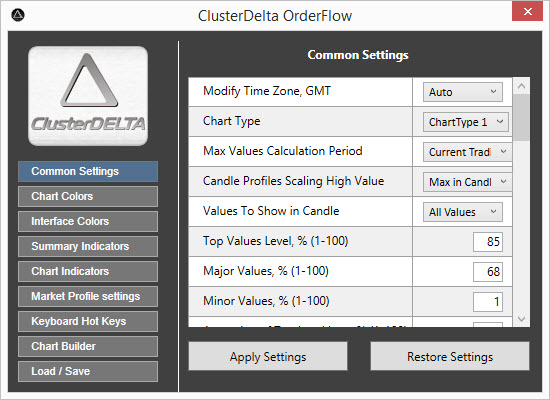
The Common Settings describe some global variables of the ClusterDelta Orderflow application. Some of them requires automatic reloading the chart. Apply Settings must be used after changing Time Zone, Chart Type and Reverse options. Restore Settings will restore the changed values by the ones that were loaded at startup (or reset in Load/Save section)
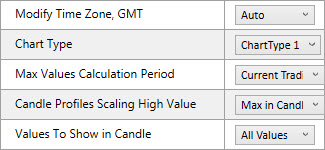
Modify Time Zone, GMT is an option to change the current time zone to a specified one (like "GMT -7", "GMT +1", "GMT +2", etc). The "Auto" value uses the local user's time zone .
Chart Type option lets you change the chart type that's loaded when you start up. The value represents the specified chart type to load on startup, according to its value in the chart type list in the Common Settings.
Max Values Calculation Period lets you choose which data periods are used to calculate the max values for a current session.
- "Current Trading Session Only" value means that the data used to calculate the maximum values of the current session is the only data available since the start of the current trading session (the exchanges trading session starts right after daily or weekend trading break time)
- "Previous + Current Session" value means that the data used to calculate the maximum values of the current session is the data available since the previous trading day
- "Fully Loaded chart" use the all loaded data for a current chart
Candle Profiles Scaling High Value lets you choose which high value will be used to scale profile in the bar.
- "Max in Candle" set the max scaling value as max value of the current bar (the maximum width of profile at the position of the maximum value in the bar has to fit all cell width)
- "Max in Calculation Period" uses the max value to scale the profile based on the max values calculated using the Max Values Calculation Period option. This option scales the profile width between the values of the different bars.
Values to Show In Candle option allows you to choose which type of values will be displayed in the candlestick.
- "All Values" shows all the data
- "Indicators values only" shows the data (full row) that is marked by any of the currently used indicators such as POC, Imbalance, Unfinished Auctions.
- "Indicators + High values" shows the data that is marked by any of the currently used indicators and the data that was calculated as "High Values"
- "High values" shows the data whose size is defined by the application as the Major Values and above (see "Major Values"/"Top Values" options).
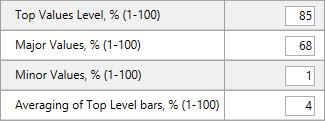
Top Values Level is an option to use the current percentage of the maximum value as the top level. If the volume size is higher than the top level, the Top colors are used for background.
Major Values is an option that allows you to use the current percentage of the maximum value as the Major level. If the volume size is above the Major level (and below the Top level), Major Value Colors are used. Also, data calculated as Major Value or Top Value is defined as High value for the Values To Show In Candle option.
Minor Values - an option that allows you to use the current percentage of the maximum value as the Minor Level. All volumes below the Minor Level use the Low Volumes color, and volumes above the Minor Level will use a gradient color between the Normal Volumes and High Volumes colors
Averaging of Top Level bars option allows you to set a percentage of the total number of bars to average the maximum value. To avoid using one-time abnormal values, the system checks, based on the calculation period, how many bars will be used to average the maximum volume. The maximum volumes from each bar are extracted to find the arithmetic average between them, and this value will be the maximum used to calculate the Top/Major/Minor levels.
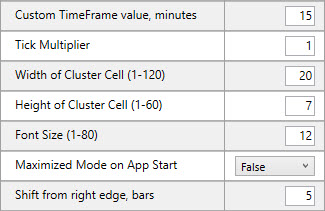
Custom Timeframe value, minutes is an option to set a custom period that will be loaded from the Timeframe drop-down list when you select the last option called “Custom”. We typically use timeframes with a multiple of 60 minutes (1m, 2m, 5m, 6m, 10m, 12m, 15m...), but if you want to use something like “8 minutes”, “25 minutes” or “90 minutes”, this option is for you.
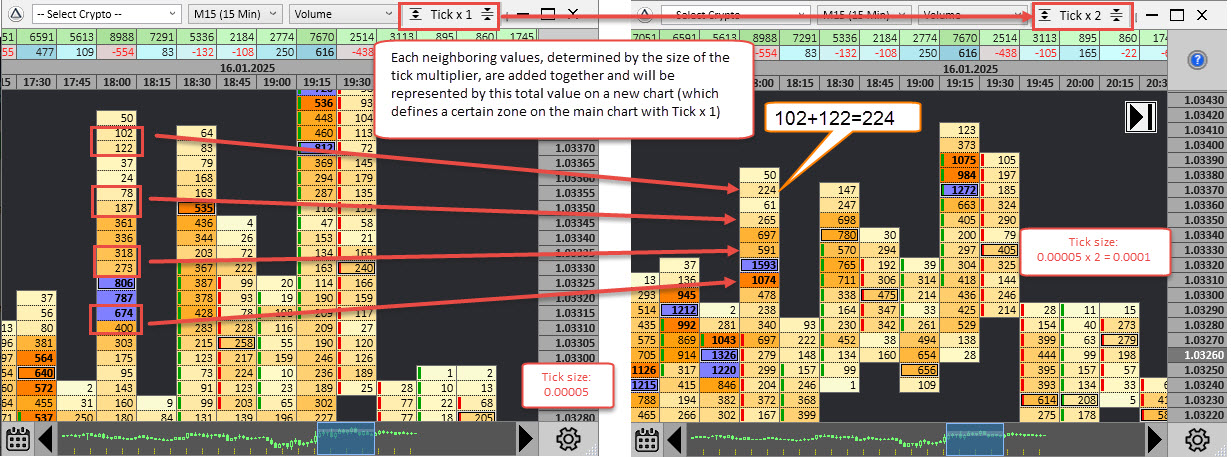
Tick Multiplier is a default value for the Tick Multiplier value in the toolbar on the title of the application. Tick Multiplier shrinks the chart by multiplying the tick size (to the tick multiplier value) and summarizing the values that come in the same price range. It helps to see volume accumulation and distribution on a high volatility chart.
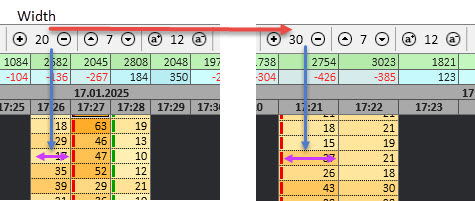
Width of Cluster Cell is a default value for the width of a one cell of the bar that applies to it at startup. This size is not in pixels
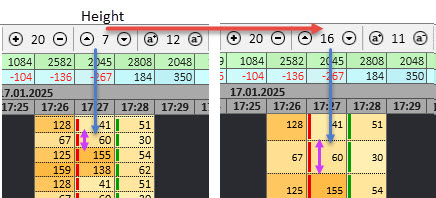
Height of Cluster Cell is a default value for the height of the cell of the bar that applies to it at startup. This size is not in pixels
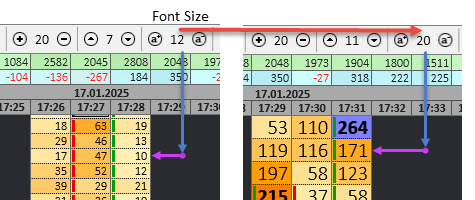
Font Size is a default value for the font size of the cell of the bar that applies to it on start up.
Maximized Mode on App Start defines whether the application must maximize itself on startup or not
Shift from right edge, bars defines on how many bars from right edge of the workspace the app must shift to the left when it switches to "Auto" mode (follow the current price mode)
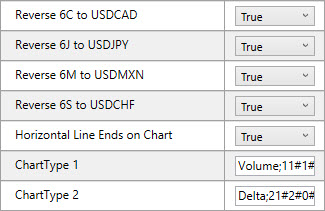
Reverse XX to USDxxx are the options to automatically reverse data from 6C/6J/6M/6S to their forex pairs known as USD/CAD, USD/JPY, USD/MXN and USD/CHF accordingly. The reversal also changes the Tick Multiplier and Tick Size to allow see the volume accumulation in the most appropriate way. Disabling the values will show normal futures data as it comes from the exchanges.
Horizontal Line Ends on Chart option is used to specify whether the custom horizontal line is continuous or must end at the point where the line intersects with a chart.
ChartType n (where n in range of 1 - 10) options are describe Chart Types in their own format. You do not need to change them manually. Using Chart Builder the values are automatically changed and available for export/import. However, you can change them manually (for example, in case of manual import of the Chart Type from another trader) but you need to understand what and why you are you doing it.


