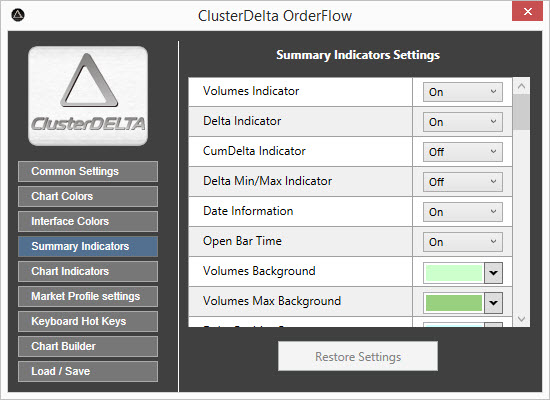
The Summary indicators describe the settings that are using by Header/Footer indicators including the colors and some specific size settings. Restore Settings button will restore the changed values by the ones that were loaded at startup (or was reset in Load/Save section)
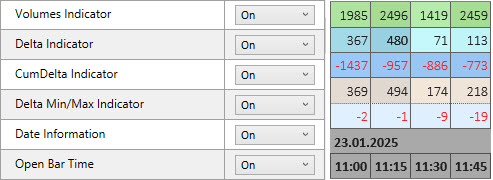
Volumes Indicator option turns the Header Volume indicator On and Off and can be used as default values on startup.
Delta Indicator option turns the Header Delta indicator On and Off and can be used as default values on startup.
CumDelta Indicator option turns the Header Cum.Delta indicator On and Off and can be used as default values on startup.
Delta Min/Max Indicator option turns the Header Delta Min/Max indicator On and Off and can be used as default values on startup.
Date Information option enables/disables the Date on the Header .
Open Bar Time option enables/disables the Time panel on the Header that shows Open Time of the Chart Bar.
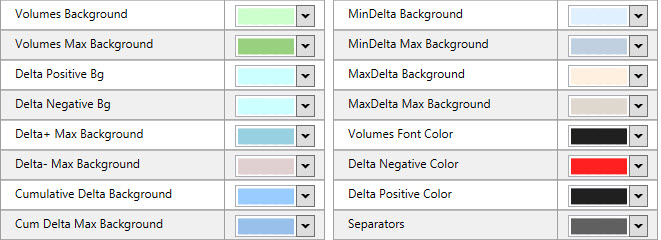
Volumes Background is the start color for the gradient to define the target color depending on the Summary Volume Value.
Volumes Max Background is the end color for the Summary Volume gradient, associated with the maximum Summary Volume value.
Delta Positive Bg is the start color for the gradient to define the target color depending on the Summary Positive Delta Value.
Delta+ Max Background is the end color for the Positive Delta gradient, associated with the maximum absolute Summary Delta value.
Delta Negative Bg is the start color for the gradient to define the target color depending on the Summary Negative Delta Value.
Delta- Max Background is the end color for the Negative Delta gradient, associated with the maximum absolute Summary Delta value.
Cumulative Delta Background is the middle(!) color for the gradient to define the target color depending on the value of Cumulative Delta using its lowest and highest value.
Cum Delta Max Background is the start and end color for the Cumulative Delta gradient, associated with the lowest and highest value of Cumulative Delta value.
MinDelta Negative Bg is the start color for the gradient to define the target color depending on the MinDelta Value.
MinDelta Max Background is the end color for the MinDelta gradient, associated with the maximum absolute MinDelta value.
MaxDelta Negative Bg is the start color for the gradient to define the target color depending on the MaxDelta Value.
MaxDelta Max Background is the end color for the MaxDelta gradient, associated with the maximum absolute MaxDelta value.
Volumes Font Color is the font color used for the Volumes indicators.
Delta Negative Color is the font color used for negative Delta values of Delta dependent indicators.
Delta Positive Color is the font color used for positive Delta values of Delta dependent indicators.
Separators is the color of lines between indicators cells.

CumDelta Reset on New Day is the option (when true) that resets the CumDelta value to zero value on midnight.
CumDelta Reset on New Week is the option (when true) that resets the CumDelta value to zero value when new week starts.
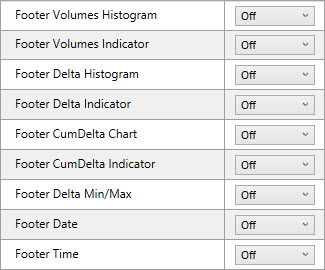
Footer Volumes Histogram option enables/disables the Footer Volume Histogram.
Footer Volumes Indicator option turns the Footer Volume indicator On and Off.
Footer Delta Histogram option enables/disables the Footer Delta Histogram.
Footer Delta Indicator option turns the Footer Delta indicator On and Off.
Footer Delta Chart option enables/disables the Footer CumDelta Chart.
Footer CumDelta Indicator option turns the Footer Cum.Delta indicator On and Off.
Footer Delta Min/Max Indicator option turns the Footer Delta Min/Max indicator On and Off.
Footer Date Information option enables/disables the Date on the Footer .
Footer Open Bar Time option enables/disables the Time panel on the Footer that shows Open Time of the Chart Bar.
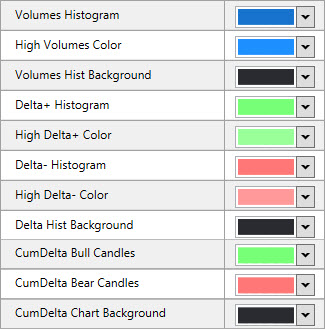
Volumes Histogram is the start color for the gradient to define the target color of the histogram depending on the Summary Volume Value.
High Volumes Color is the end color for the Summary Volume gradient, associated with the maximum Summary Volume value.
Volumes Hist Background is the background color of the Volume Histogram panel.
Delta+ Histogram is the start color for the gradient to define the target color of the histogram depending on the Summary Positive Delta Value.
High Delta+ Color is the end color for the Summary Positive Delta gradient, associated with the maximum absolute Summary Delta value.
Delta- Histogram is the start color for the gradient to define the target color of the histogram depending on the Summary Negative Delta Value.
High Delta- Color is the end color for the Summary Delta gradient, associated with the maximum Summary absolute Delta value.
Delta Hist Background is the background color of the Delta Histogram panel.
CumDelta Bull Candles is the color for the CumDelta candlestick when the last CumDelta value is greater than the starting CumDelta value..
CumDelta Bear Candle is the color for the CumDelta candlestick when the last CumDelta value is less than the starting CumDelta value.
CumDelta Chart Background is the background color of the CumDelta Chart panel.
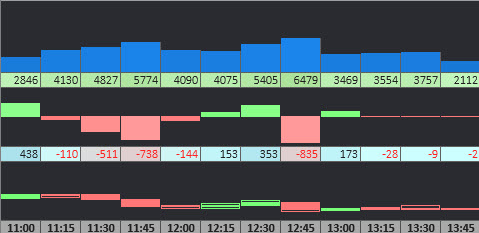
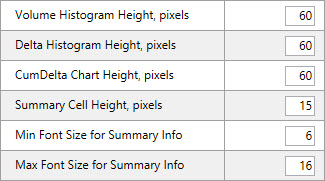
Volume Histogram Height is the height of the Volume Histogram in pixels. It can be changed on the chart by dragging over the top edge of the histogram.
Delta Histogram Height is the height of the Delta Histogram in pixels. It can be changed on the chart by dragging over the top edge of the histogram.
CumDelta Histogram Height is the height of the CumDelta Histogram in pixels. It can be changed on the chart by dragging over the top edge of the histogram.
Summary Cell Height is the height of the summary cell in pixels.
Min Font Size for Summary Info is the minimum font size required to display text in the summary cell. The application calculates the required font size based on the current width and height of the cell and the length of the text. If the font size is greater than Min Font Size the text is displayed.
Max Font Size for Summary Info is the maximum font size for the text displayed in the summary cell to make the data readable and not overload the chart even if the cell size is large enough.


