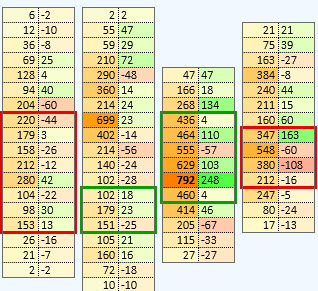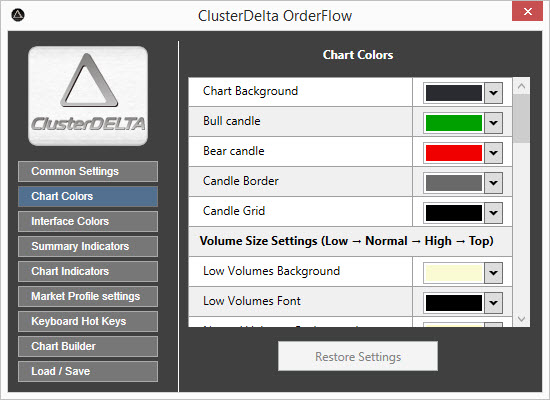
The Chart Colors describe mostly colors that are used during chart drawing. Restore Settings button will restore the changed values by the ones that were loaded at startup (or was reset in Load/Save section)

Chart Background is the background color of the Workspace.
Bull Candle is the color for all drawings of the bull bar (candle left, boxes inside, border around body) .
Bear Candle is the color for all drawings of the bear bar
Candle Border is the color of the solid line around all the cells of the cluster
Candle Grid is the color of the dotted vertical and horizontal lines inside the cells between rows and columns
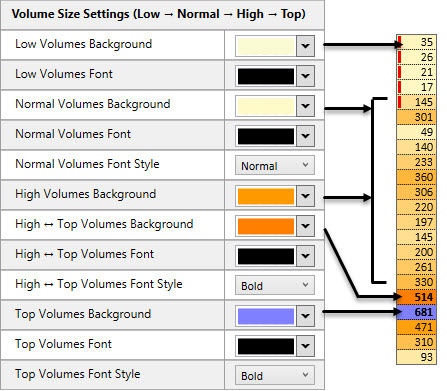
Low Volumes Background is the background for the values that are lower than Minor level (see Common Settings, Minor Value, Major Value, Top Value).
Low Volumes Font is the font color for Minor values.
Normal Volumes Background is the start color of the gradient background for the values that are between Minor and Major level.
Normal Volumes Font is the font color for Normal values.
Normal Volumes Font Style is the font style for Normal values, which can be Normal or Bold
High Volumes Background is the end color of the gradient background for the values that are between the Minor and Major levels.
High ↔ Top Volumes Background is the static background color for the High values that are higher than the Major level but lower than the Top level.
High ↔ Top Volumes Font is the font color for the High values .
High ↔ Top Volumes Font Style is the font style for High values, which can be Normal or Bold
Top Volumes Background is the background color for the Top values that are higher than Top level.
Top Volumes Font is the font color for the Top values .
Top Volumes Font Style is the font style for Top values, which can be Normal or Bold
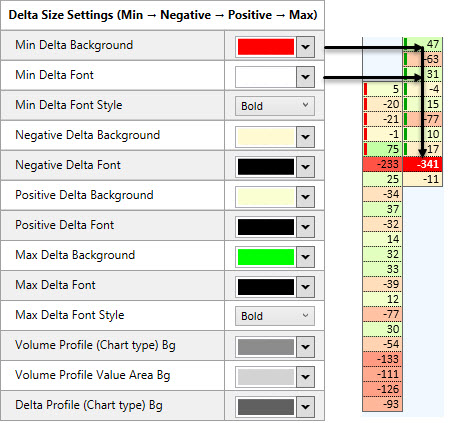
Min Delta Background is the background for the Delta Negative values that are higher (in absolute value) than the Top Delta value, which is calculated using the same logic as the Top Volume value. This color also used as the end color of the gradient background for Normal Negative Values together with Negative Delta Background color as the start color.
Min Delta Font is the font color for Top Delta Negative values.
Min Delta Font Style is the font style (Normal/Bold) for Top Delta Negative values
Negative Delta Background is the start color of the gradient background for the Normal Delta Negative values that are between 0 and Top Delta with negative sign.
Negative Delta Font is the font color for Normal Negative values.
Positive Delta Background is the start color of the gradient background for the Normal Delta Positive values that are between 0 and Top Delta with positive sign.
Positive Delta Font is the font color for Normal Positive values.
Max Delta Background s the background for the Delta Positive values that are higher than the Top Delta value. This color also used as the end color of the gradient background for Normal Positive Values together with Positive Delta Background color as the start color.
Max Delta Font is the font color for Top Delta Positive values.
Max Delta Font Style is the font style (Normal/Bold) for Top Delta Positive values
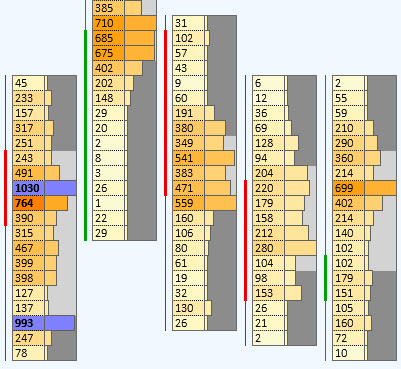
Volume Profile (Chart Type) Bg is the background for the volume profile cell type if the Chart Type option Profile Bg is in use (see Chart Builder)
Volume Profile Value Area Bg is the background for the volume profile cell type of the Value Area if the Chart Type option Profile Bg is in use (see Chart Builder) and the option Chart Indicators -> VAL/VAH Settings, Mark Value Area in Candle Profiles has value "True"
Delta Profile (Chart Type) Bg is the background for the delta profile cell type if the Chart Type option Profile Bg is in use
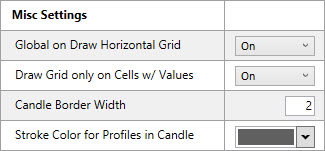
Global on Draw Horizontal Grid is an option that, when set to "off", does not allow the horizontal grid to be drawn, regardless of other settings (including the Chart Type setting).
Draw Grid Only on Cells w/ Values is an option that, when set to "on", does not allow the horizontal grid on the cells that do not contain the values (useful for profiles as it mention on the picture with profiles above)
Stroke Color for Profiles in Candle is the color to round the profile rectangle in the cell to separate them each from other
Candle Border Width is an option for people, who wants to change the basic width of the border that is used to draw the body of the candle
