
")

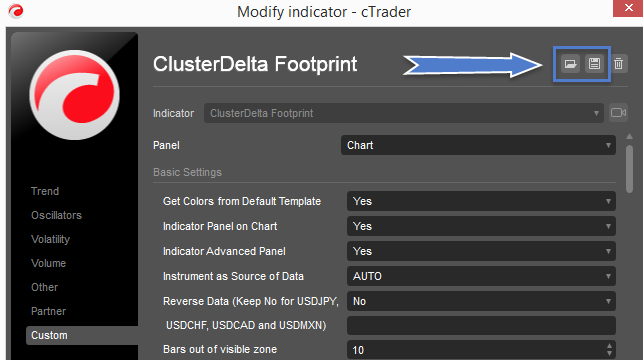
Indicator Name: ClusterDelta Footprint
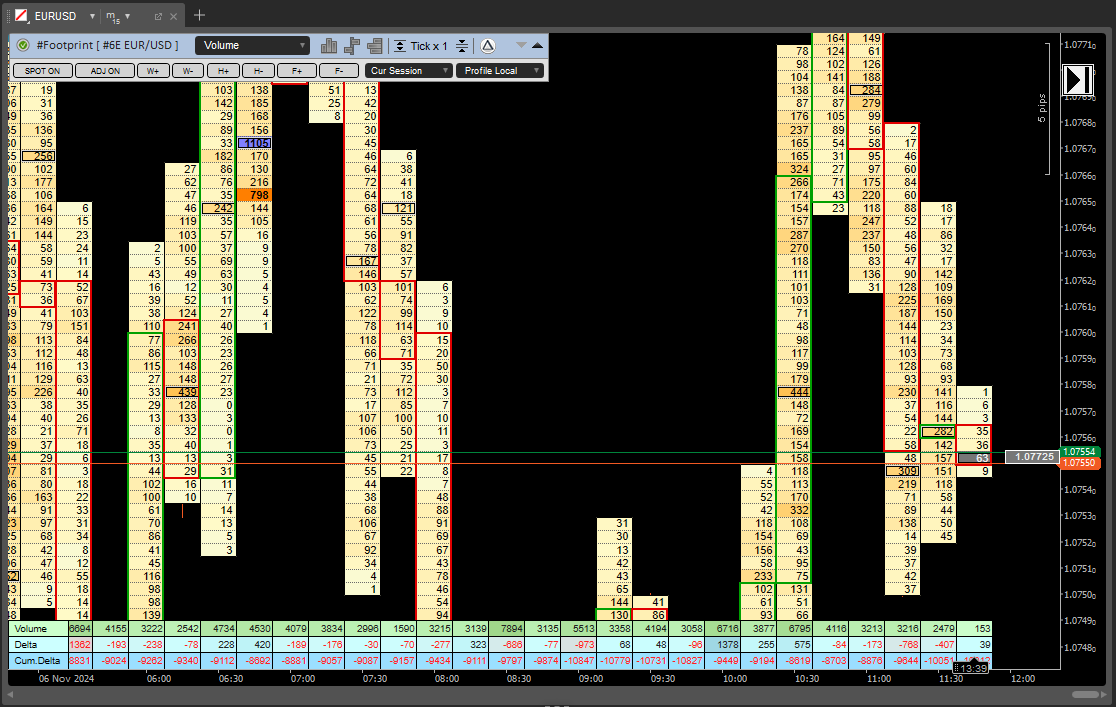
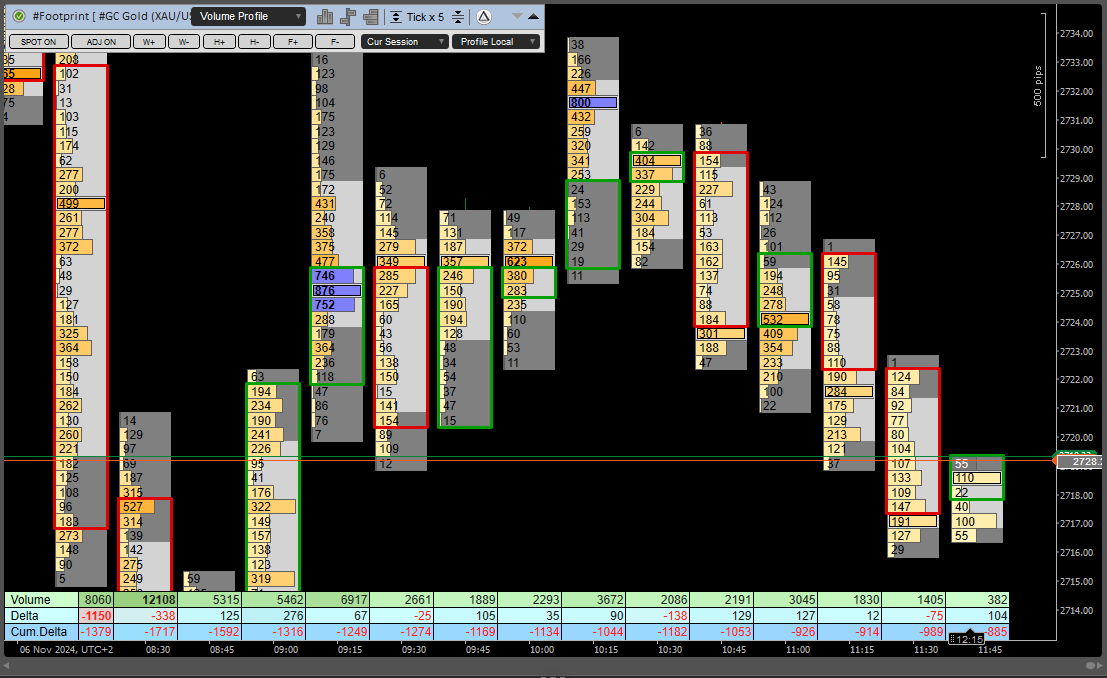
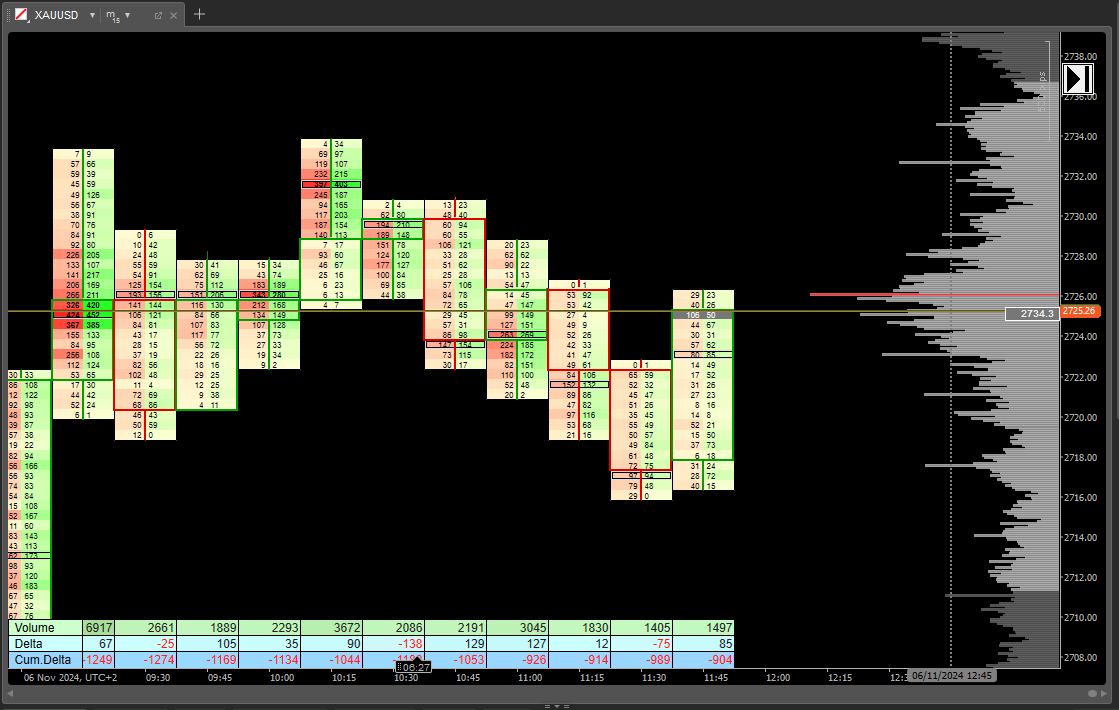
Footprint is a type of the chart where you can see sum of the traded volumes at a specified price for a certain period. Commonly the Footprint term is used with the term Order Flow.
The #Footprint indicator allows us to see accumulation and distribution of market volumes. This gives us to conduct accurate analysis based on how the markets were traded.
ClusterDelta Footprint indicator for cTrader is a replica of the ClusterDelta Footprint indicators that were already released for MetaTrader, NinjaTrader and as the ClusterDelta Orderflow app.
Software has an intuitive interface, I hope you can understand it quickly. Some help there is inside the application.
ClusterDelta Footprint indicator for cTrader is a very powerful tool, and we strongly recommend that you take some time to understand its functionality and settings to find out all the possibilities that the indicator can show you. At the same time, the interface is very intuitive. For now ClusterDelta was released the different versions for the different trading terminals. The Footprint is ready for such trading terminal as MetaTrader, cTrader, NinjaTrader and there is the ClusterDelta Orderflow Application for Windows and MacOS. All of these products has the same idea and the same data source but functionality may be a little bit different from terminal to terminal. Just a small remind, that big amount of objects in cTrader freezes a terminal, so read the "Optimization tips" to get it more powerful
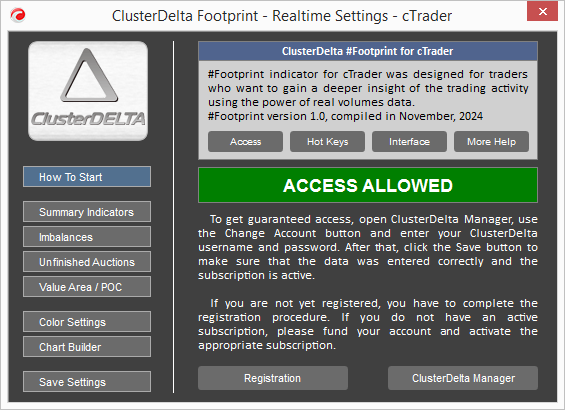
If you just downloaded the indicator and ready to start to use it, please do not forget to put your ClusterDelta username and password into the Authorizer. The Authorizer icon is on the left side of the Footprint toolbar panel. A green authorization icon means that authorization was successful. An orange icon means the subscription will expire in less than 3 days. A red icon indicates that the subscription was not found (or the user is not authorized). The blue icon asks that the current authorization status is not loaded yet
Description of the functionality will be divided for 4 sections:
- Description of the Footprint workspace
- Orderflow chart as a collection of the cTrader objects
- Footprint Chart Adjust Settings
- Hot Keys for navigation
- Optimization tips
- Footprint Toolbar Panel Description
- RealTime Settings Window
- How To Start
- Indicators
- Color Settings
- Chart Builder
- Save Settings
- Description of the Indicator Settings
DESCRIPTION OF THE FOOTPRINT WORKSPACE
Orderflow chart as a collection of the cTrader objects
CTrader allows you to apply custom objects to a chart. Whether it is a horizontal or vertical line, a rectangle or text, they are all called “Drawings” and internally represent a list of objects that cTrader should redraw each time the visual part of the chart changes. So, if you put a horizontal level on some price, the cTrader core automatically maintains that level on scrolling the chart window.
This makes it easy for programmers to work with objects by simply changing their prices and time coordinates. At the same time, each object requires CPU time to redraw again. The orderflow chart of the Footprint indicator for cTrader is a collection of “Drawings” such as Text, Horizontal Line, Vertical Line, Rectangle or Filled Cell. At least 3 objects are required for each cell of the Orderflow chart with a value.
A large number of objects becomes a problem for the cTrader engine. Trying to redraw objects while scrolling, keep them in the visible area and remove them from it in case of a large number (>10000) takes some time, during which the trading terminal may freeze.
The Orderflow chart from the Footprint indicator for cTrader tries to manage objects so as not to leave an unprecedented number of them on the chart. The indicator has a “garbage collector” that runs during user inactivity to remove unnecessary objects from the visible area. The default settings try to keep the orderflow chart view with the same view used in ClusterDelta_#Footprint for MetaTrader or ClusterDelta Orderflow Application, so there is an option to remove lines between cells to increase performance. Please see the Optimization tips on this page.
Footprint Chart Adjust Settings
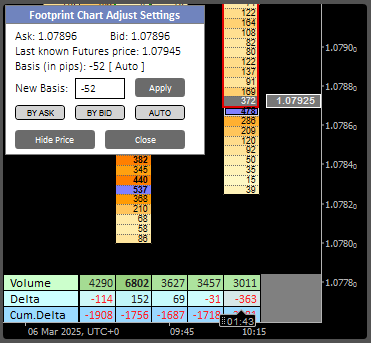
As mentioned above, Orderflow chart are objects plotted directly over the candlesticks of a chart using Time/Price coordinates. If you install the indicator on a spot or cfd instrument, you need to find the Basis value (the difference between the spot price and the futures price) to position the Orderflow chart. The futures market and the spot market move almost identically, but certainly not exactly the same. In addition, Basis value changes every day and sometimes 2-3 times within a day, so even with the same chart formations, we may find that it is not easy to adjust the Orderflow chart position to the correct spot chart position for the current spot chart and for it to match the spot chart that was active a few hours ago.
The automatic detection of the Basis Value is based on a comparison of the High and Low prices of the current trading session. The value older in time is used. You can set the Basis values in the Indicator Inputs, the option name is "[Expert] Manual Spot Shift in points" with the "[Expert] Auto Spot Adjusting" option turned off. At any time, you are able to change these options without reloading by click on the current price box. P key hides or shows the current price box.
After clicking on the current price box, a small window "Footprint Chart Adjust Settings" will appear in the left top corner. It contains the last known spot and futures prices, the current Basis value in pips and the option whether it is set manually or calculated automatically.
Using the text filed you can manually set the basis value, there are also "By Ask"/"By Bid" buttons that calculate the current price difference between the spot (ask/bid) and futures (last) price and set this value in the text field. The "Auto" button puts the value "AUTO" in the text field, which means automatic calculation mode after application. The "Apply" button must be clicked when the New Basis value is set and ready to be confirmed. "Hide Price" remove the current price box and the "Close" button removes the current window of Basis changing from the chart.
Hot Keys for navigation
If you try to move the chart using the left/right arrow keys, cTrader automatically zooms to fit the chart into the visible area, the up/down arrows change the timeframe, which causes the chart and indicator to reload. If you want to use the keyboard to navigate the chart, use the following keys.
- W scrolls chart up
- A scrolls chart down
- S scrolls chart left
- D scrolls chart right
- Q scrolls chart left by one window with
- E scrolls chart right by one window
- Enter scrolls chart to the last bar and turns the Online mode for chart to follow the current price. The End key would be too instead but it is required to unbind the End key from the cTrader settings in the HotKeys section.
- F12 scroll the chart to the first loaded bar with orderflow data. The Home key would be used too but it is required to unbind the End key from the cTrader settings in the HotKeys section.
There are several other hot keys that cTrader uses to navigate chart on its own way (PgUp, PgDn, +, - ). Check for all of these buttons in the cTrader settings and remember that these buttons will change the price scale or scaling, which will also affect the order flow chart.
Optimization tips
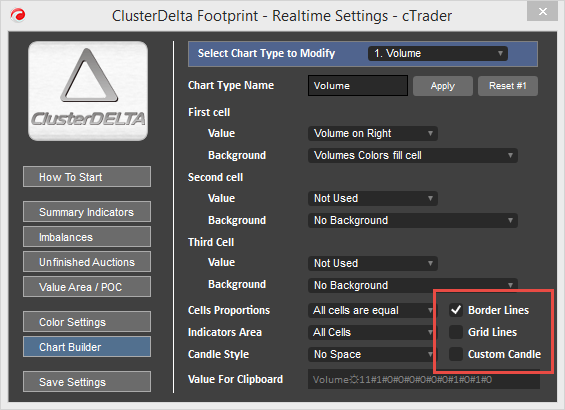
Footprint for cTrader is based on cTrader objects, so at high resolution and small scale it requires a large number of objects that cTrader must process, and generally does not do so very quickly. First recommendation is to remove Grid Lines and than Border Lines / Custom Candle to check the performance and than add them depends on your needs. This windows may be called by i key or with indicators icon on the footprint toolbar on the indicator panel.
- use tick multiplier on high volatile charts
- do not keep footprint (and other clusterdelta indicators) on other charts that you do not plan to use, as they consume CPU resources
- save workspaces for your own options set
- check the inputs description on how to load history data instead of using "Load more history" button
- do not turn on the internal footprint indicators if you do not use it
FOOTPRINT TOOLBAR PANEL DESCRIPTION

Footprint for cTrader has an indicator panel that allows you to interactively change some parameters/modes with immediate result on the order flow chart.
In the upper left corner you can see the access status icon. Blue icon means that you need to enter the data into the authorizer, red icon means that your access is not allowed, orange icon warns you that your access is allowed but it will expire soon and green icon means that everything is ok.
To the right of the status icon is the indicator name “#Footprint” and the symbol of the Orderflow chart that is currently displayed in the chart window.
The list next to the indicator name define the chart types. There are:
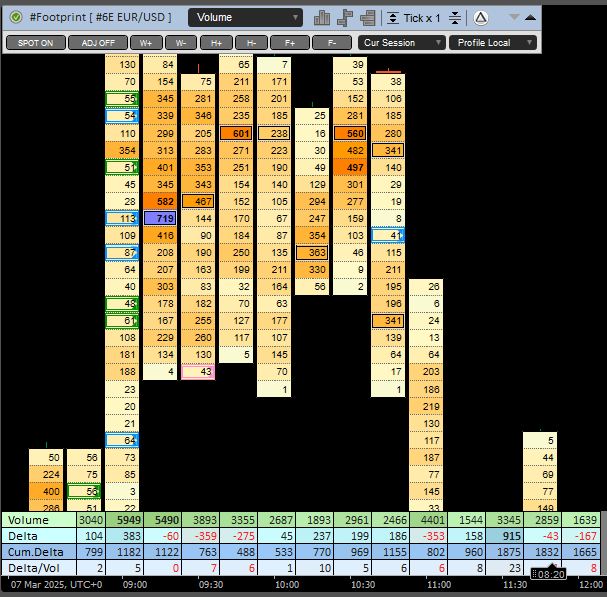
- Volume - a chart displaying volume data
- Delta - a chart showing delta data
- Bid x Ask - a chart where the bid and ask are displayed
- Volume x Delta - a chart that displays volumes delta as columns in the cell with different color schemes
- Ask x Bid , Bid x Ask / VP, Volume Profile and others.
All charts can be modified using the chart builder of the current indicator. You can change the data type, color scheme, text align, etc. Please refer to the "Chart Builder" section on this page.
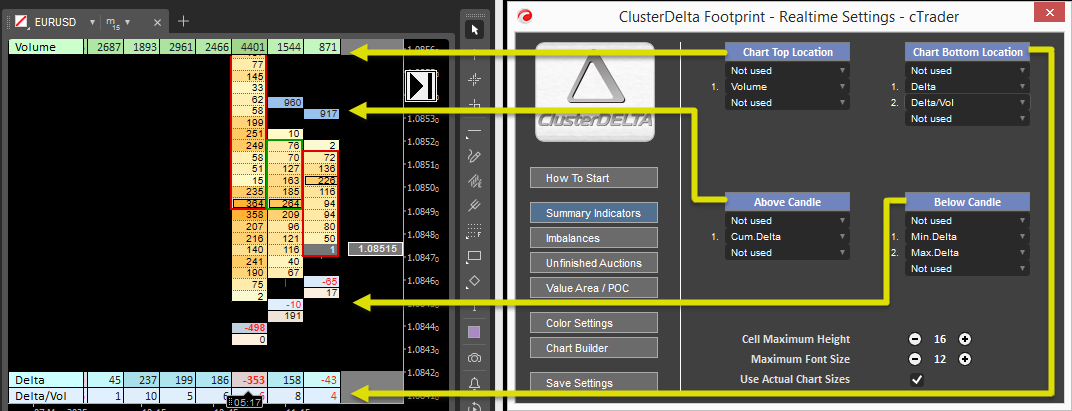
The next three icons to the right of the chart type list are buttons for quick access to the "Summary Indicators", "Imbalances" and "Value Area/POC" sections of the "RealTime Settings" window. You can use any of them to open the "RealTime Settings" window to access other sections such as "Color Settings", "Chart Builder", "Save Settings".
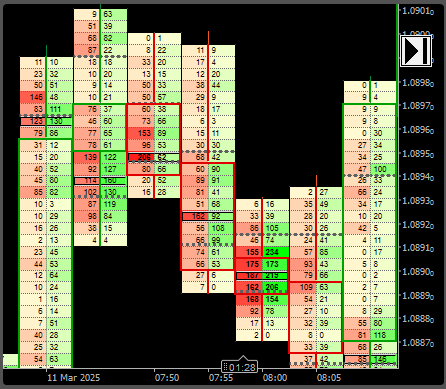
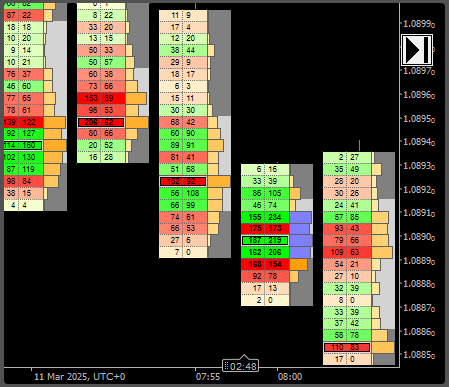
For a better understanding of high volatility markets there is a "tick multiplier" option. Next buttons right to the indicator icons around "Tick x 1" text are tick multiplier modifiers. Just compare to the charts below for the same instrument/timeframe/time but with different Tick x 1 and Tick x 20 multipliers for FDAX (the screens taken from the "#Footprint for MetaTrader" page):
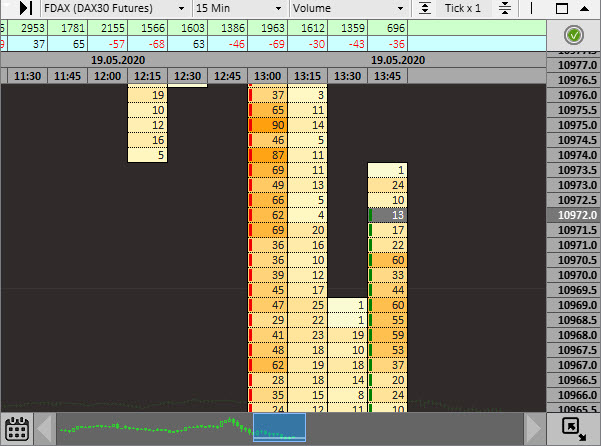
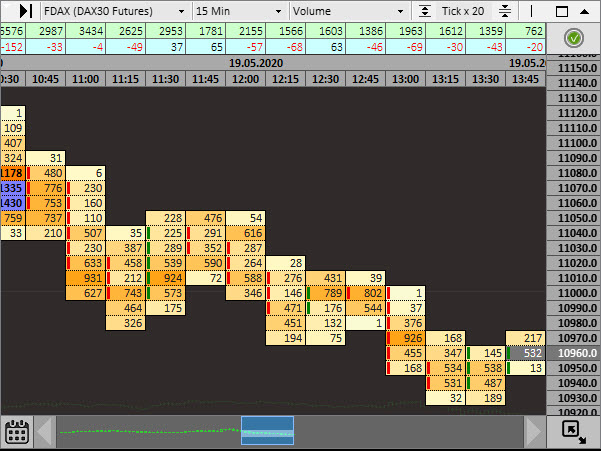
All volumes included in one step are summarized. You can find the size of the price step in the price panel.
The icon with a ClusterDelta logo to the right of the tick multiplier is a button for quick access to the "How to Start" section in the "RealTime Settings" window to get basic information about the first steps after running the indicator. The opened "RealTime Settings" window allows you to use any section.
The last down/up arrows control the appearance of the indicator. The down arrow button opens the Advanced Panel section. The up arrow button closes the Advanced Panel first, and if it is closed, closes the indicator panel 5 seconds after clicking it. The Indicator panel can be hide with the Z key and restored with the X key.
Advanced Panel Description
- SPOT ON/OFF enables/disables the option to hide/show the native spot chart. ON means that the cTrader native chart is displayed, while OFF hides it, changing the candle colors to the background value. In some situations, if you want to reset the colors manually, it can be done by right-clicking on the chart and using "Color Options", "Reset to Default"
- ADJ ON/OFF enables/disables the option to automatically adjust the order flow chart according to spot chart prices. ON means enabled.
- W+, W- increases/decreases the cell width by changing cTrader zoom parameter. W+ increases it by 35, W- decreases it by 20
- H+, H- increases/decreases the cell height. It looks for the best new cell height to use there the new font with the font size changed by +1/-1 .
- F+, F- - buttons for changing the current font size by the value of an additional size modifier, determined by F+ / F- buttons. The modifier value is added to the button name. Available range is -5..+5
- Calculation Period list lets you choose which data periods are used to calculate the max values for a current session that applies to the color scheme of the chart as it depends from the absolute maximum value ("Cur Session" value means that the data used to calculate the maximum values of the current session is the only data available since the start of the current trading session, "Last+Current" value means that the data used to calculate the maximum values of the current session is the data available since the previous trading day, "Loaded chart" uses the all loaded data for a current chart)
- Profile Scaling Mode lets you choose which high value will be used to scale profile in the bar. ("Profile Local" sets the max scaling value as max value of the current bar, "Profile Global"uses the max value to scale the profile based on the max values calculated using the Max Values Calculation Period option. This option scales the width of the profile, synchronizing it with values in other bars)
FOOTPRINT INDICATOR SETTINGS WINDOW
This window provides quick access to the most used functions, allowing you to change settings without reloading the chart and indicator. The window contains basic information on how to get started, indicator sections, settings sections including “Color Settings”, “Chart Builder” and ‘Save Settings’ where you can create a custom workspace that overwrites the default cTrader settings.
How To Start
The content of this page has the quick references to the descriptions of the Hot Keys and the Advanced Toolbar in the Interface tab, the More Help button opens the official page of the description of the cTrader Footprint Indicator. If you have just downloaded and installed the indicators, they will not work without an active subscription. Use the "Register" button to sign up at https://my.clusterdelta.com if you are not registered yet. If you have registered, you have to order and activate the subscription in your cabinet.
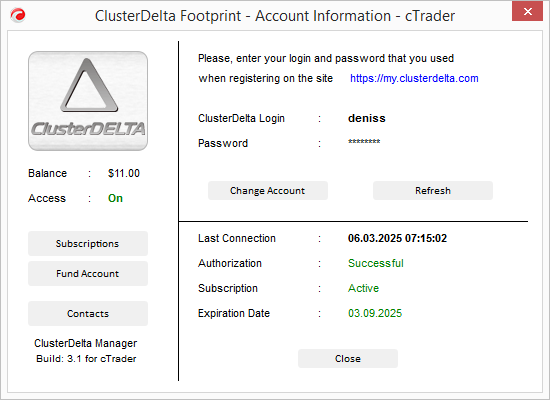
To work with cTrader indicators without interruption, you must enter your ClusterDelta Login and Password into "ClusterDelta Manager" (also known as Authorizer). Open it by clicking the "ClusterDelta Manager" button or by clicking the access status icon on them main toolbar, use the "Change Account" button, enter your details, and press "Save". "Refresh" to confirm correct entry, that Authorization is Successful and Subscription is Active with a valid Expiration Date. All of the ClusterDelta product authorizers on the same computer share the login credentials.
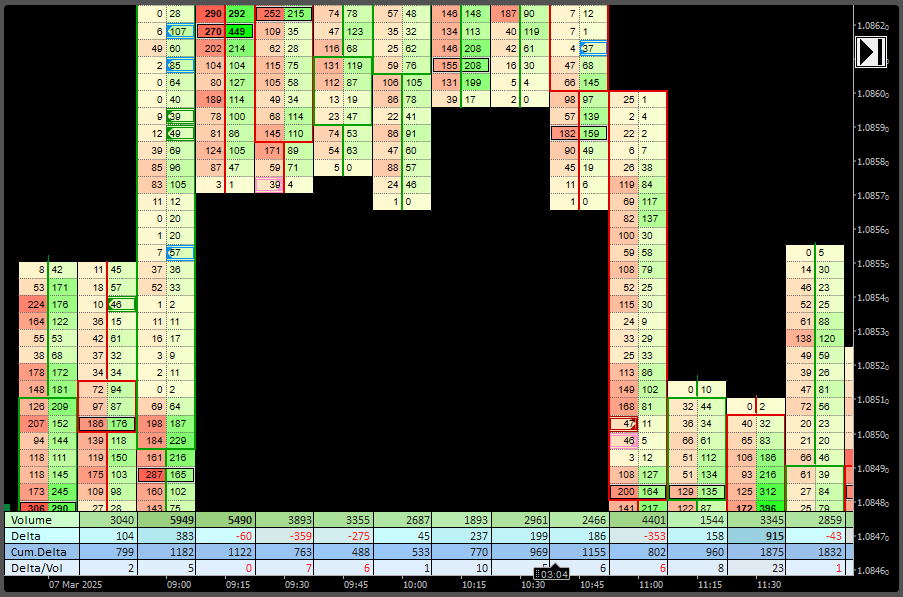
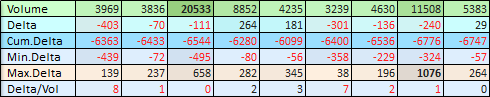
Summary Indicators
The Summary Indicators section allows you to customize your workspace with summary data such as volumes/delta per bar, cumulative delta, min/max delta, and Delta/Volume ratio in percentage. There are four positions. fixed Top and Bottom chart positions and dynamic position of summary data above and below the candle. The distance between the summary data boxes and the candle is determined by the "Above/Below Distance from Cell" parameter in the Settings section "3.Summary Indicator Settings". The summary data uses its own cell height and font size, so the "Cell Maximum Height" and "Maximum Font Size" options set the maximum values for these options (the corresponding parameter names in the settings "Max Font Size" and "Max Cell Height"). The "Use Actual Chart Sizes" option applies only to the "Above/Below" candle position and changes the default height and font size to those used inside the candle (the corresponding parameter name in the settings is "Actual Size for Above/Below Summary").
Imbalances
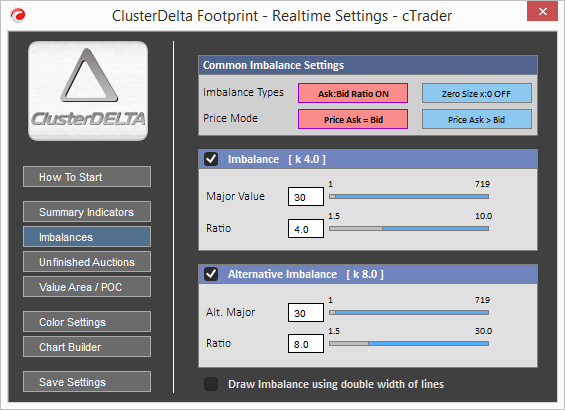
The Imbalance indicator shows you the zones where the ratio between Ask and Bid values is abnormal. The main option is the Ratio coefficient. When the result of dividing of Ask:Bid or Bid:Ask is more than the Ratio, there's imbalance. There are two types of imbalances. The Ask:Bid Ratio calculates the value and compares it to the Imbalance Ratio when the Zero side is just an imbalance where the left or right part has no volumes (zero value).There are two modes of imbalances. Price Ask=Bid calculates the ratio between Ask and Bid in the same row (on the same price) when Ask>Bid uses for calculations Ask volume above Bid volume.
There are preconditions to get imbalance more accurate. Minor Size is a minimum value of lesser value in calculation, and Major Size is a minimum value of greater part of Imbalance. If you change the Minor Size to a value of 0, Footprint indicator for cTrader will also mark Zero Imbalances if the Major Size condition is met. The Minor Size is the lowest value above the slider of the Major values. The corresponding options are "Minor value of bid / ask" and Major value of bid / ask". The full information about Imbalance customization are in the section of "Description of the Indicator Inputs" -> "4. Imbalance Indicator Settings"
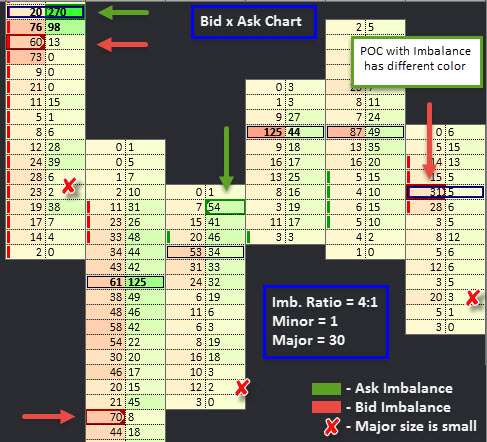
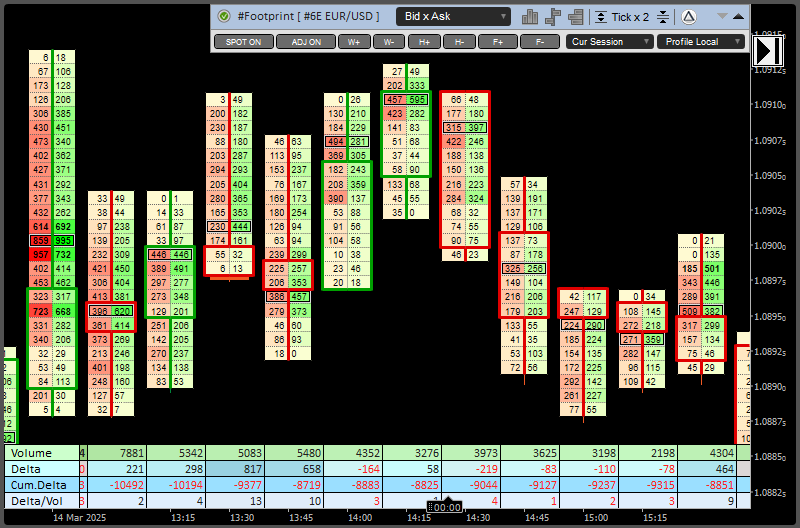
By default settings Bid Imbalance is marked by red color and Ask Imbalance by green. Check the imbalances above: 270:20 = 13 that is greater than current Ratio that is 4 (you can change Imbalance Ratio within range 1.5 - 10), 60:13 >4, 70:8 >4, and so on. 23:2 >4, but 23 is less than Major value (30) so it is not marked as an Imbalance. When Imbalance and POC are on the same price, POC has different color , options are Highlight Imbalance on POC, Highlight POC Imbalance Color, check the "9.Imbalance Colors section").
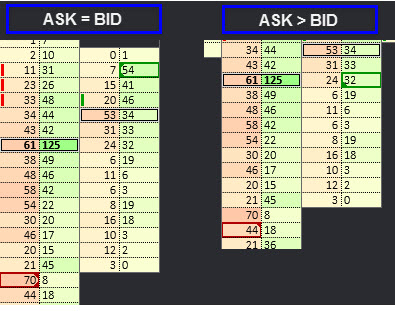
If cell value type is Bid or Ask, Imbalance marks only the larger side of the Imbalance pair. Depending on the Imbalance Mode, you can find small arrows that represent the placement of the opposite value to which the calculation was made. Two arrows at the top and bottom of the imbalance object means that the imbalance was calculated with a value on the same row. The arrow at the Top of the Bid imbalance or at the Bottom of the Ask imbalance represents the direction of the opposite value when Imbalance type is Ask price > Bid price .
In general, Imbalance do not use high or low position of the candle but it is may be changed in the option Calculate Imbalance on High/Low. Also there are some more options related to Imbalances, the ranges of the Minor/Major values and so on. All of them are described in the Settings section.
Alternative Imbalance is the possibility to separate the high Ratio Imbalances from the Normal ones. The Alternative Imbalance Range is 1.5 - 30 and it is required that Alt.Ratio must be greater than Ratio of the Normal Imbalance because Alternative Imbalance always overwrites Normal Imbalance.
Alternative Imbalance has completely its own settings so the options are not shared between Normal and Alternative Imbalances
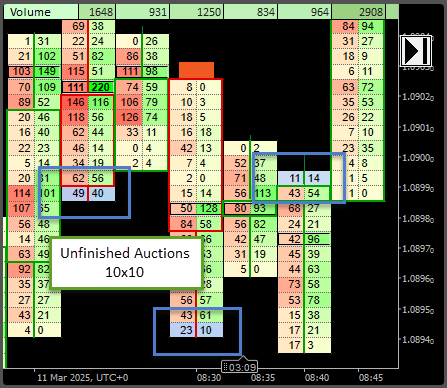
Unfinished Auctions
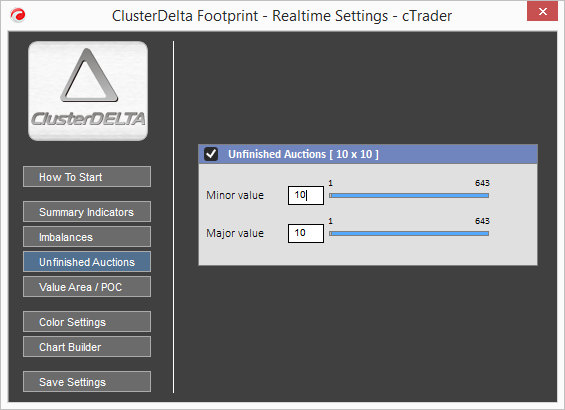
Unfinished auctions is the zone only at the high price or low price of the bar where both values of Ask and Bid are not zero. The presence of the opposite value shows that prices has attention to move further with the same direction but was met by a pressure from the opposite side and had to be reversed.
In order to filter out unnecessary unfinished auctions, there are Minor and Major sizes, which correspond to the lower and higher sizes of the Ask:Bid pair at the peak of the candle. Auctions are usually finished when the highest price has a bid size as zero and the lowest price has a ask size as zero.
Value Area / POC
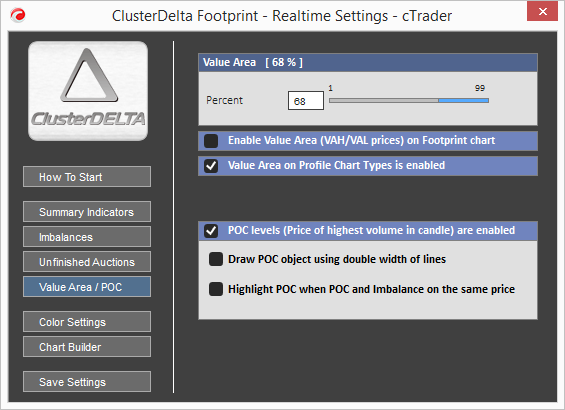
The Value Area slider changes the current value of the Value Area option which determines on how much volumes from the total amount must be inside Value Area.
Enable Value Area checkbox turns on/off the option to show lines in the candle that represent the Value Area
Value Area on Profile Chart Types checkbox turns on/off the option to show background in the candle cell of the profile type that represent the Value Area
POC levels is the price where the highest amount of volumes were traded. It is a rectangle around the values and it can use double width of the lines if you need it more bolder. Use "Draw POC object using double width" for this. If you would like to mark the POC price with a different color when it has the same position as the Imbalance, use the "Highlight POC when POC and Imbalance on the same price" option.
All the options are represented in the description of the options in the "6.Value Area / POC" section.
Color Settings
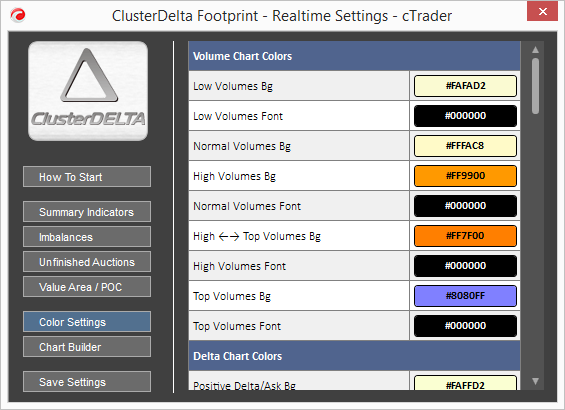
The Color Settings tab is designed to find the right color template for your footprint chart. It is very complicated to do it through the cTrader Options Panel, because it always reloads the indicator on each color change. The color set will be used during the current indicator session, but you can save the color set in the template and use it later. Please refer to the "Saving settings" section to learn more about how it works.
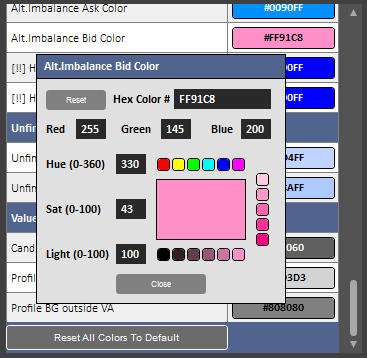
The Color Settings window can be set by the RGB hex color, by the Red, Green, Blue decimal values (0-255) or by the HSL color model, where HUE is the circle of the color palette from 0 to 360 (degrees), Saturation and Lightness has the range from 0 to 100 and Lightness also. Please note that RGB and HUE are not 100% compatible. The "Reset" button restores the color as it was in the template of the indicator at the start.
The "Reset All Colors to Default" button removes all the color changes and restore an original color palette.
Chart Builder
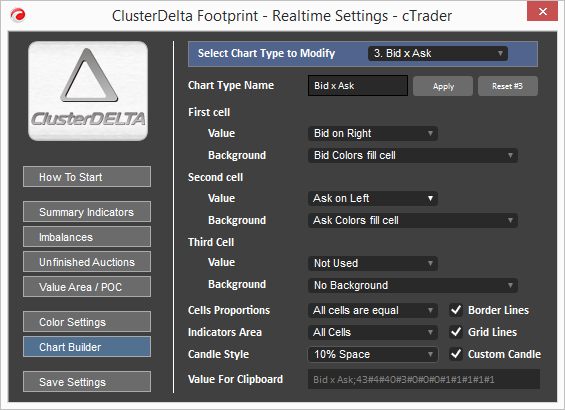
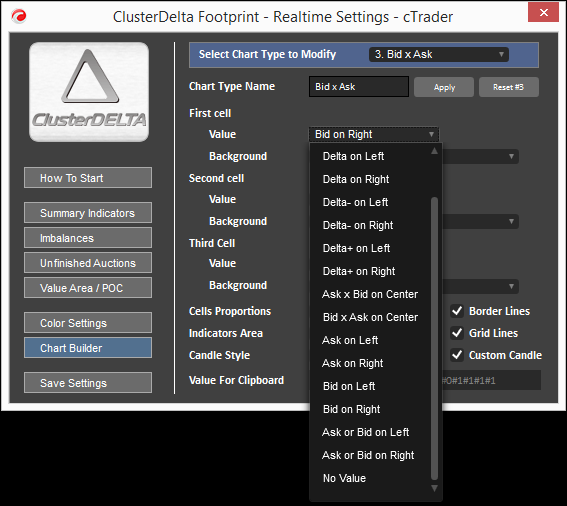
The Chart Builder allows you to customize the chart according to your needs. The chart can be split up in 3 cells. Each cell contains a value and a background. In each cell, the value can be one of the following: Volume, Delta, Delta Negative only, Delta Positive only, Ask, Bid, Ask or Bid (larger value), Ask and Bid (or Bid and Ask) or No Value.
Each value can be left- or right-aligned ("Ask x Bid" or "Bid x Ask" are center-aligned). "No Value" is useful if you intend to use to use a cell with a background profile, but, in general, with no value, any background is acceptable. The values "Bid x Ask" and "Ask x Bid" are included to use one background (like a volume profile) behind these values.
On the top there is the list of the current chart types. You can select the one to modify, by default current chart type is selected. To the right of the Chart Type Name field there is an "Apply" button that rename the current chart type to the value that is in the text field. The "Reset" button restores all the settings of the current chart to the default ones as they were at the start.
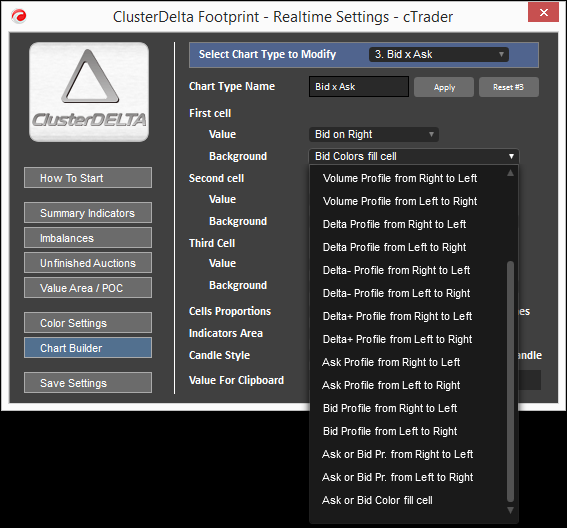
Each cell contains one of the available backgrounds (which have the "No Background" option . The background can fill the cell with its own color depending on its type, or it can be used as a profile whose length is a part of the cell in the same ratio as the value (corresponding to the type of background) relative to the maximum value for that type. Profiles can be directed from Left to Right or from Right to Left, where the first word defines the starting side of the cell.
There are 6 additional options for the Chart Builder plus a textbox field to take the value for a clipboard.
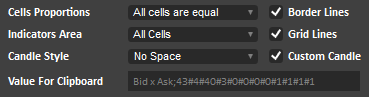
The Cell Proportions is a correlation of the width between the cells.
- All cells are equal - by default each cell has the same width
- The next 3 values First/Last/Middle cell is bigger defines the cell that will use 2/3 of the common width of 2 cells or 1/2 of the width of 3 cells.
Indicators Area defines which cells can be used to place Indicators objects. For example for the chart like Bid x Ask x Volume or Bid x Ask x Volume Profile, it is not necessary to use the 3rd cell for indicators like POC or Imbalance, because two cells of Bid x Ask are more than enough to place the Indicator objects in the right way. In this example the proper value is "Cells 1 and 2" without 3rd cell.
Candle Style defines the space between two candles. The available values are "No Space", "10%" and "20%". It gives a little bit better visualizing of the orderflow chart and allows candle lines to be drawn out of the candle data.
Border Lines draws the border around the candle. May be turned off for optimization.
Grid Lines draws the dotted lines between cells in the candle (horizontal and vertical). May be turned off for optimization.
Custom Candle draws the body and wick of the candle around Open-Close prices. It respects the Indicators Area value.
Value For Clipboard is the value for the cTrader Parameters window to copy/paste. The format is not yet compatible with other ClusterDelta Footprint indicators and applications.
Here there are some examples of the different chart types and how it looks. All changes into chart builder are immediately shown on the Orderflow chart.
Do not forget to save your custom chart via value for clipboard.
Save Settings
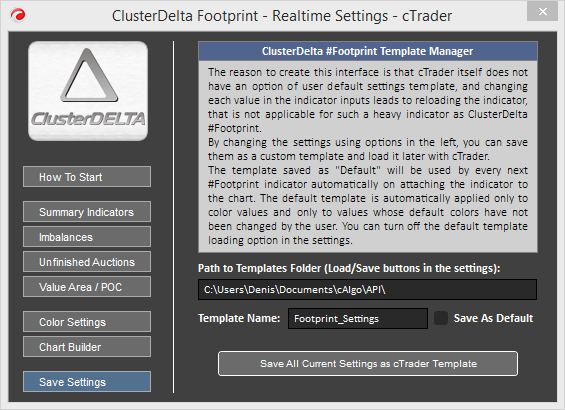
The reason to create this interface is that cTrader itself does not have an option of user default settings template, and changing each value in the indicator inputs leads to reloading the indicator, that is not applicable for such a heavy indicator as ClusterDelta #Footprint.
By changing the settings using options in the left, you can save them as a custom template and load it later with cTrader.
The template saved as "Default" will be used by every next #Footprint indicator automatically on attaching the indicator to the chart. The default template is automatically applied only to color values and only to values whose default colors have not been changed by the user. You can turn off the default template loading option in the settings.
Path To Templates Folder is the current path where cTrader store the folders by default.
Template Name is the name of the file with template of the current settings
Save as Default sets the name to "Footprint_Default" (extension: .indiset) that is hardcoded for the footprint indicator as the default name to load when you attach the indicator to the next chart
The button Save All Current Settings as cTrader Template confirms your choose to save the settings
How to work with Templates in the Footprint Indicator
- Open the Object manager, Indicators tab (use right mouse on the chart or press Ctrl+i)
- Go to the Settings of the Indicator
- Click the Load or Save template button to check the default path for cTrader templates and check that it is the same in the Path To Templates Folder field.
When you change the colors via Color Settings tab and Save All Settings in the Save Settings tab, the Footprint indicator creates the file where it stores all the colors represented in the Color Settings tab.
Your own template. You can load the Color Template via cTrader Load Template button and save it together with other settings as the native cTrader template. Remember, check that the option "Get Colors from Default Template" is disabled (value "No") to not overwrite your current colors with possible saved default color template for footprint indicators. To use this template, it is required to load it each time when you put the footprint indicator on the chart.
Default template. If you saved the colors with "Save as Default" option it creates the default with predefined name "Footprint_Default.indiset". The file loaded if the option "Get Color from Default Template" is enabled but only those colors will be used that were not changed by the user and have the default values that were hardcoded during indicator compilation. In other words, any color that a user changes in the cTrader settings will not be overwritten by the color from the previously saved default footprint color template. From one perspective, it provides a flexibility with settings and the same time always overwrites default colors for each next indicator attached to the chart.
DESCRIPTION OF THE INDICATOR SETTINGS
Basic Settings
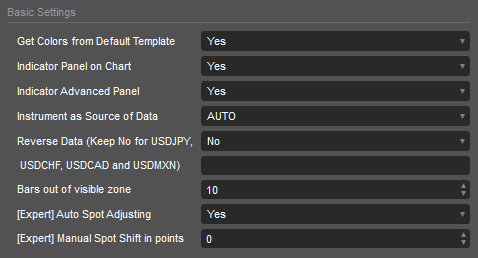
Get Colors from Default Template is to use default color template modified with the built in Color UI and saved as mentioned in the paragraph above.
Indicator Panel on Chart show or hides Header of the Bookmap Panel
Indicator Advanced Panel show or hides Advanced Panel additionally to the header Bookmap Panel
Instrument as Source of Data - select a futures from the dropdown list as the source for data. Value AUTO causes automatic detection of the instrument using the cTrader ticker.
Reverse Data is an option for reverse the Bookmap data for reversed currency pairs except those that have name "USDJPY", "USDCAD", "USDCHF", "USDMXN". This option was added for compatibility, but in 99.9% of cTrader cases leave it "No".
Bars out of visible zone is a value to keep only this amount of the bars out of the visible area of the chart window to not overload the cTrader core by not-in-use objects. The small amount will allow you to make the scrolling much smoother.
[Expert] Auto Spot Adjusting is an option that allows you to adjust Footprint data to the spot chart using the latest highs and lows of the current trading session. The difference that is automatically calculated using this option may vary from trading session to trading session, so this may result in incorrect alignment of Footprint data for different trading sessions.
[Expert] Manual Spot Shift in points sets the manual value to be used to adjust Footprint data to the spot chart. Use the middle mouse button to measure the distance in points to use this value in this option. Also you can use the price box to change this value after indicator attaching.
History Data
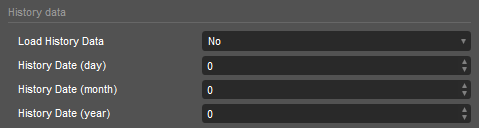
Load History Data. "No" means that data loading for the current day/trading session. If you change this option, you have to put the correct History Date to load in the options below the current one (day/month/year).
1. Common Settings
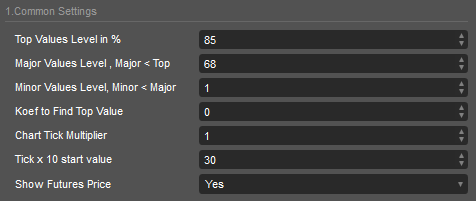
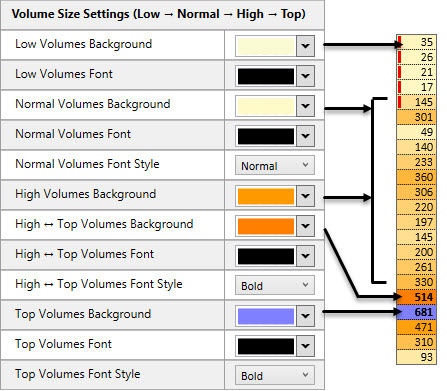
Top Values Level in % is an option to use the current percentage of the maximum value as the top level. If the volume size is higher than the top level, the Top colors are used for background.
Major Values Level is an option that allows you to use the current percentage of the maximum value as the Major level. If the volume size is above the Major level (and below the Top level), Major Value Colors are used. Also, data calculated as Major Value or Top Value is defined as High value for the Values To Show option in the drawing section.
Minor Values Level - an option that allows you to use the current percentage of the maximum value as the Minor Level. All volumes below the Minor Level use the Low Volumes color, and volumes above the Minor Level will use a gradient color between the Normal Volumes and High Volumes colors
Koef to Find Top Value option allows you to set a percentage of the total number of bars to average the maximum value. To avoid using one-time abnormal values, the system checks, based on the calculation period, how many bars will be used to average the maximum volume. The maximum volumes from each bar are extracted to find the arithmetic average between them, and this value will be the maximum used to calculate the Top/Major/Minor levels.
Tick Multiplier is a default value for the Tick Multiplier value in the toolbar on the title of the application. Tick Multiplier shrinks the chart by multiplying the tick size (to the tick multiplier value) and summarizing the values that come in the same price range. It helps to see volume accumulation and distribution on a high volatility chart.
Tick x 10 Start Value is a tick multiplier value where the increment becomes 10 for the tick multiplier values above and becomes 1 for the tick multiplier values below the value.
Show Futures Price is a visible box with a current futures price on the chart. The price box may be used to manually change the "Manual Spot Shift" value.
2. Drawing Settings
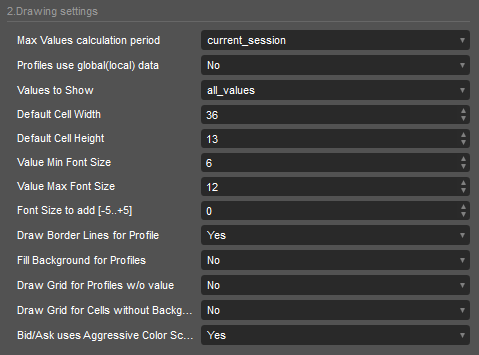
Max Values Calculation Period lets you choose which data periods are used to calculate the max values for a current session.
- Current Session value means that the data used to calculate the maximum values of the current session is the only data available since the start of the current trading session (the exchanges trading session starts right after daily or weekend trading break time)
- Previous Session value means that the data used to calculate the maximum values of the current session is the data available since the previous trading day
- Loaded chart use the all loaded data for a current chart
Profile use global(local) data lets you choose which high value will be used to scale profile in the bar.
- Yes uses the max value to scale the profile based on the max values calculated using the Max Values Calculation Period option. This option scales the profile width between the values of the different bars.
- No set the max scaling value as max value of the current bar (the maximum width of profile at the position of the maximum value in the bar has to fit all cell width)
Values to Show option allows you to choose which type of values will be displayed in the candlestick.
- All Values shows all the data
- Indicator only shows the data (full row) that is marked by any of the currently used indicators such as POC, Imbalance, Unfinished Auctions.
- Indicator and high shows the data that is marked by any of the currently used indicators and the data that was calculated as "High Values"
- High values only shows the data whose size is defined by the application as the Major Values and above (see "Major Values"/"Top Values" options).
- No values does not display any data in the Orderflow chart cells (useful to see the Orderflow chart only by background color)
Default Cell Width is a default value for the width of a one cell of the bar that applies to it at startup. This size is in pixels.
Default Cell Height is a default value for the height of the cell of the bar that applies to it at startup. This size is in pixels.
Value Min Text Size is a minimum value for the font size of the text inside the cell. If the text does not fit with this size in the cell, the text will not be drawn
Value Max Text Size is a maximum value for the font size of the text inside the cell for better visualization.
Font size to add [-5..+5]. Depending on the scaling, the calculated font size may be larger or smaller than desired. You can use a constant font size increment to the calculated font size, which depends on the current cell width and height. You can change this option on the toolbar.
Draw Border Lines for Profile - an option that allows you to make a rectangle around the profile field in a cell to visualize the profile more clearly.
Fill Background for Profiles - an option that allows you to fill the cell background with profile background color or keep it transparent. This option is not used if the Value Area Indicator for Profile is enabled.
Draw Grid for Profile w/o value - an option that allows you to draw the horizontal grid lines between cells that do not print any data. The option is for visualization purposes.
Draw Grid for Cells without Background - an option that allows you to draw the horizontal grid lines between cells that do not use background colors. The option is for visualization purposes.
Bid/Ask uses Aggressive Color Scheme - an option that uses the absolute maximum Delta value for Bid/Ask colors rather than the maximum Bid or Ask values. This allows you to get a more aggressive visualization of the Bid x Ask orderflow chart at the maximum values.
3. Summary Indicators Settings
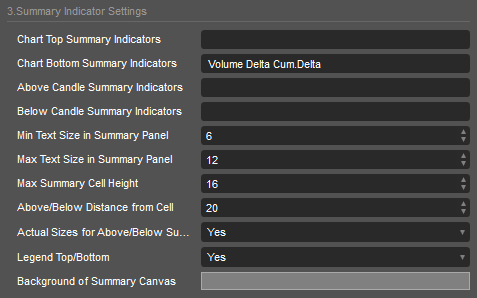
Chart Top / Chart Bottom / Above Candle / Below Candle Summary Indicators. There are four positions for the summary indicators as it is mentioned above in the Realtime Window / Summary Indicators paragraph. Static Top/Bottom of the window and dynamic Above/Below the candle. The values are the space-separated values that can take following values (case sensitive):
Volume Delta Cum.Delta Min.Delta Max.Delta Delta/Vol
The summary indicators appear in the order of appearance in the option field.
Min Text Size in Summary Panel is a minimum value for the font size of the text inside the cell of the summary indicator. If the text does not fit with this size in the cell, the text will not be drawn
Max Text Size in Summary Panel is a maximum value for the font size of the text inside the cell of the summary indicator.
Max Summary Cell Height is a cell height of the summary cells that use summary settings (and not Actual Sizes)
Above/Below Distance from Cell is a distance from Highest / Lowest point of the cell to Lowest / Highest point of the summary (positioned Above/Below the candle) indicator cell in pixels
Actual Sizes for Above/Below Summary Indicator is a an option to use the current Orderflow chart font size/cell height for the summary cells of the summary indicators poisitioned Above/Below the candle/
Legend Top/Bottom - an option that determines whether or not to show the names for the summary indicator rows.
Background of Summary Canvas is a color that is technically required for Top/Bottom canvas background.
4. Imbalance Indicator Settings
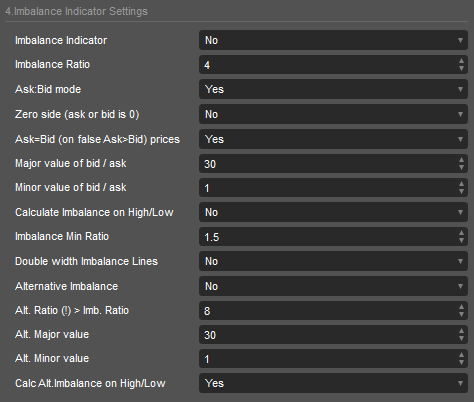
Imbalance Indicator option turns the Imbalance On and Off and can be used as a default value at startup.
Imbalance Ratio is the minimum Ask:Bid or Bid:Ask ratio that must be reached to activate the Imbalance object on the chart.
Ask:Bid mode option turns on/off the mode "Ask:Bid" where both values are non zero and lower value of the Ask:Bid pair is greater than a minor size and largest value is greater than a major size.
Zero size option turns on/off the mode "Zero side" where one of the value is zero and another value is greater than a minor size.
Ask=Bid (on false Ask>bid) (Calculate Mode) option switches the Imbalance between two modes "Ask=Bid" and "Ask>Bid". Ask=Bid modes means that Ask:Bid calculations use the same row values while "Ask>Bid" uses the Ask value 1 tick above the Bid value for calculations .
Major Value of bid / ask is a required minimum value of the larger value in the Ask:Bid pair.
Minor Value of bid / askis a required minimum value of the lower value in the Ask:Bid pair.
Calculate Imbalance on High/Low is the option that allows to use the High/Low of the bar to calculate Imbalances (normally this is not the case).
Imbalance Min Ratio is the minimum of the allowed Imbalance Ratio in the Imbalance Indicator dialog window
Double width Imbalance Lines is the option to use the double thickness for the Imbalance rectangle objects
Alternative Imbalance Indicator option turns the Alternative Imbalance On and Off and can be used as a default value at startup.
Alt. Ratio (!) > Imb. Ratio is the required Ask:Bid or Bid:Ask ratio that must be reached to activate the Alternative Imbalance object on the chart and this value must be greater than the Imbalance Ratio.
Alt.Major Value is a required minimum value of the larger value in the Alternative Imbalance Ask:Bid pair.
Alt.Minor Valueis a required minimum value of the lower value in the Alternative Imbalance Ask:Bid pair.
Calc. Alt.Imbalance on High/Low is the option that allows to use the High/Low of the bar to calculate Alternative Imbalances.
5. Unfinished Auctions
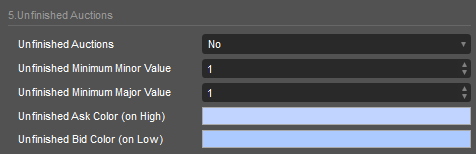
Unfinished Auctions option turns the Unfinished Auctions On and Off and can be used as a default value at startup.
Unfinished Minimum Minor Valueis a required minimum value of the lower value in the Ask:Bid pair of Unfinished Auction.
Unfinished Minimum Major Value is a required minimum value of the larger value in the Ask:bid pair of Unfinished Auction.
Unfinished Ask Color (on High) is the color of the Unfinished Auctions on the High price of the bar.
Unfinished Bid Color (on Low) is the color of the Unfinished Auctions on the Low price of the bar.
6. Value Area / POC
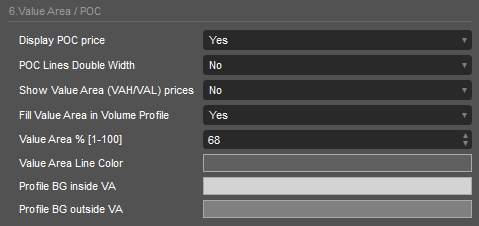
Display POC price option enables/disables the drawing POC object on the chart where the largest amount of volumes were traded.
POC Lines Double Width is the option to use the double thickness for the POC rectangle objects
Show Value Area (VAH/VAL) prices option enables/disables the drawing the VAL/VAH line objects on the orderflow chart.
Fill Value Area in Volume Profiles option enables/disables the drawing of Value Area in the candle cell using different background colors if chart cell background is a profile.
Value Area % [1-100] option sets the percentage of the total amount of the traded volumes within the Value Area compared to the total volumes of the cell.
Value Area Line Color is the color for the VAL/VAH lines in the candle of the Order flow chart.
Profile BG inside VA is the background of the cells in the Value Area. The Background Color is applied only to the cells which background is set as a profile and the Fill Value Area in Volume Profile option is set to Yes.
Profile BG outside VA is the background of the cells out of the Value Area. The Background Color is applied only to the cells which background is set as a profile and the File Value Area in Volume Profile option is set to Yes.
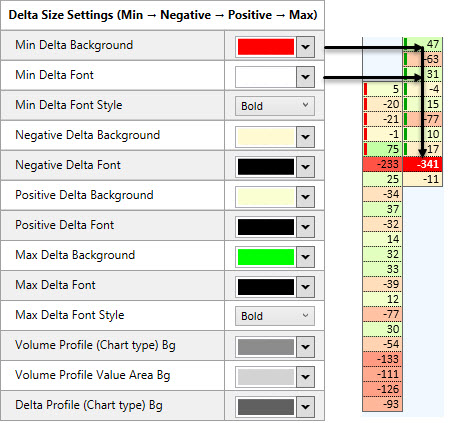
7. Footprint Colors
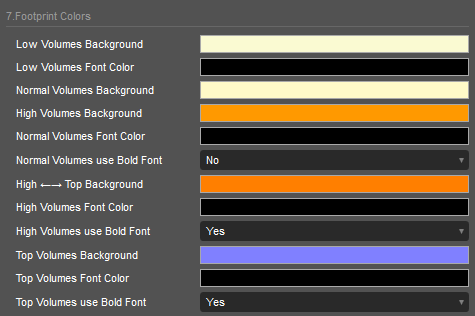
Low Volumes Background is the background for the values that are lower than Minor level (see Common Settings, Minor Value, Major Value, Top Value).
Low Volumes Font Color is the font color for Minor values.
Normal Volumes Background is the start color of the gradient background for the values that are between Minor and Major level.
High Volumes Background is the end color of the gradient background for the values that are between the Minor and Major levels.
Normal Volumes Font Color is the font color for Normal values.
Normal Volumes use Bold Font is the font style for Normal values, which can be Normal or Bold
High ↔ Top Background is the static background color for the High values that are higher than the Major level but lower than the Top level.
High Volumes Font Color is the font color for the High values .
High Volumes use Bold Font is the font style for High values, which can be Normal or Bold
Top Volumes Background is the background color for the Top values that are higher than Top level.
Top Volumes Font Color is the font color for the Top values .
Top Volumes use Bold Font is the font style for Top values, which can be Normal or Bold
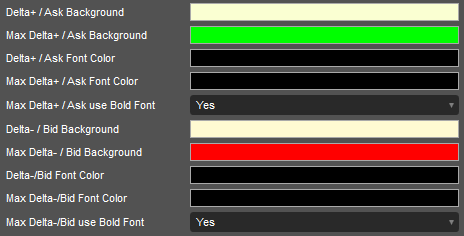
Delta+ / Ask Background is the start color of the gradient background for the Normal Delta Positive values (or Ask Values) that are between 0 and Top Delta with positive sign or Top Ask for Ask values .
Max Delta+ / Ask Background s the background for the Delta Positive / Ask values that are higher than the Top Delta / Ask value. This color also used as the end color of the gradient background for Normal Positive Values together with "Delta+ / Ask Background" color as the start color.
Delta+ / Ask Font is the font color for Normal Delta Positive / Ask values.
Max Delta+ / Ask Font is the font color for Top Delta Positive / Ask values.
Max Delta+ / Ask use Bold Font is the font style (Normal/Bold) for Top Delta Positive / Ask values
Delta- / Bid Background is the start color of the gradient background for the Normal Delta Negative / Bid values that are between 0 and Top Delta with negative sign or Top Bid for Bid values.
Max Delta- / Bid Background is the background for the Delta Negative values / Bid that are higher (in absolute value) than the Top Delta / Top Bid value, which is calculated using the same logic as the Top Volume value. This color also used as the end color of the gradient background for Normal Negative / Bid Values together with Delta- / Bid Background color as the start color.
Delta- / Bid Font Color is the font color for Normal Negative / Bid values.
Max Delta- / Bid Font Color is the font color for Top Delta Negative / Bid values.
Max Delta-/Bid use Bold Font is the font style (Normal/Bold) for Top Delta Negative / Bid values
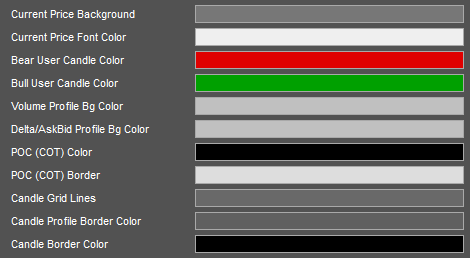
Current Price Background is the background color of the price box where the current price is showing.
Current Price Font Color is the font color of the current price in the price box.
Bull User Candle Color is the color for all drawings of the bull bar (candle left, boxes inside, border around body).
Bear User Candle Color is the color for all drawings of the bear bar.
Volume Profile Bg Color is the background for the volume profile cell type if the Chart Type option Profile Bg is in use.
Delta/AskBid Profile Bg Color is the background for the Delta or AskBid profile cell type if the Chart Type option Profile Bg is in use.
POC (COT) Color is the color of the Inner Rectangle of the POC Object.
POC (COT) Border is the color of the Outer Border of the POC Object.
Candle Grid Lines Color is the color of the grid lines that separate cells in the orderflow bar.
Candle Profile Border Color is the color to round the profile rectangle in the cell to separate them each from other
Candle Border Color is the color of the border lines around the orderflow bar.
8. Summary Indicators Colors
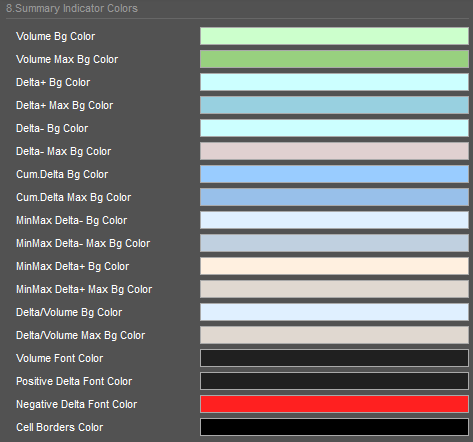
Volume Bg Color is the start color for the gradient to define the target color depending on the Summary Volume Value.
Volume Max Bg Color is the end color for the Summary Volume gradient, associated with the maximum Summary Volume value.
Delta+ Bg Color is the start color for the gradient to define the target color depending on the Summary Positive Delta Value.
Delta+ Max Bg Color is the end color for the Positive Delta gradient, associated with the maximum absolute Summary Delta value.
Delta- Bg Color is the start color for the gradient to define the target color depending on the Summary Negative Delta Value.
Delta- Max Bg Color is the end color for the Negative Delta gradient, associated with the maximum absolute Summary Delta value.
Cum.Delta Bg color is the middle(!) color for the gradient to define the target color depending on the value of Cumulative Delta using its lowest and highest value.
Cum.Delta Max Bg Color is the start and end color for the Cumulative Delta gradient, associated with the lowest and highest value of Cumulative Delta value.
MinMax Delta- Bg Color is the start color for the gradient to define the target color depending on the MinDelta Value.
MinMax Delta- Max Bg Color is the end color for the MinDelta gradient, associated with the maximum absolute MinDelta value.
MinMax Delta+ Bg Color is the start color for the gradient to define the target color depending on the MaxDelta Value.
MinMax Delta+ Max Bg Color is the end color for the MaxDelta gradient, associated with the maximum absolute MaxDelta value.
Delta/Volume Bg Color is the start color for the gradient to define the target color depending on the Delta/Volume Value.
Delta/Volume Max Bg Color is the end color for the Delta/Volume gradient, associated with the maximum absolute Delta/Volume value.
Volume Font Color is the font color used for the Volumes indicators.
Positive Delta Font Color is the font color used for positive Delta values of Delta dependent indicators.
Negative Delta Font Color is the font color used for negative Delta values of Delta dependent indicators.
Cell Borders Color is the color of lines between indicators cells.
9. Imbalance Colors
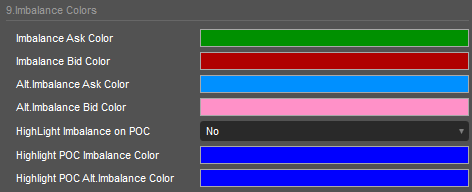
Imbalance Ask Color is the color of the Imbalance object if Ask>Bid and Ask:Bid is equal to or greater than the Imbalance Ratio.
Imbalance Bid Color is the color of the Imbalance object if Bid>Ask and Bid:Ask is equal to or greater than the Imbalance Ratio.
Alt. Imbalance Ask Color is the color of the Alternative Imbalance object if Ask>Bid and Ask:Bid is equal to or greater than the Alternative Imbalance Ratio.
Alt. Imbalance Bid Color is the color of the Alternative Imbalance object if Bid>Ask and Bid:Ask is equal to or greater than the Alternative Imbalance Ratio .
Highlight Imbalance on POC is the option to make the Imbalance more visible if the POC object and the Imbalance object appear on the same price/
Highlight POC Imbalance Color is the color that the POC object takes if Imbalance and POC are on the same price and the Highlight option above is enabled.
Highlight POC Alt.Imbalance Color is the color that the POC object takes if Alternative Imbalance and POC are on the same price and the Highlight option above is enabled.
10. Description of Chart Types
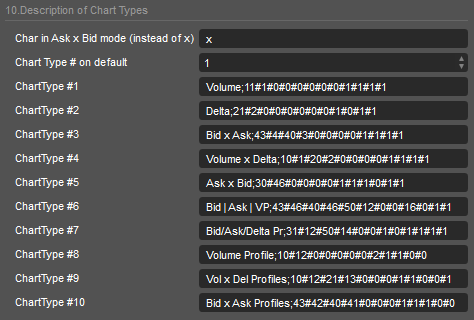
The Chart Types strings contain prepared settings for the orderflow chart. It is not necessary to explain this format here as it is automatically generated by the Chart Builder, so you can use it to generate this string. The Chart Types strings are not 100% compatible with other ClusterDelta Footprint/Orderflow products
11. Tips and Social Networks
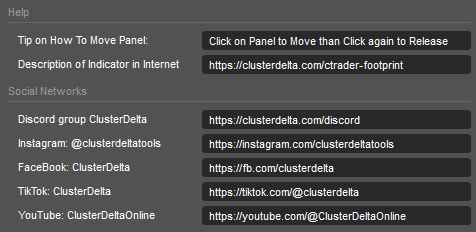
Help Url section is the URL to get the full documentation about indicator
Social Networks are the links to join our Discord and follow us in the Instagram and other social networks

