
")
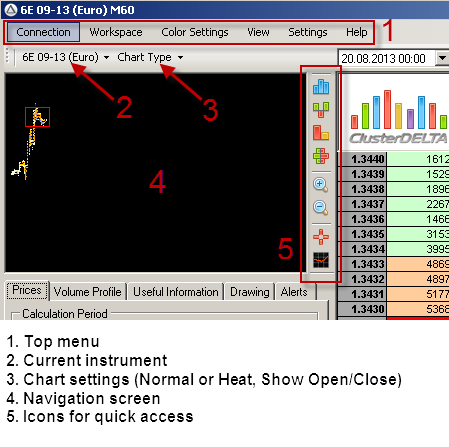
1. Top menu
2. Current instrument
3. Chart display settings (normal / minimized mode and the function "Show the prices of bar open-close")
4. This area is called the navigation panel. It contains a mini chart and helps to navigate quickly by dragging a red rectangle.
5. The icons of quick access to useful functions down from the top: volume mode, delta mode, volume x delta mode, purchase x sales mode, zoom in, zoom out, crosshair, indicators.
Workspace:
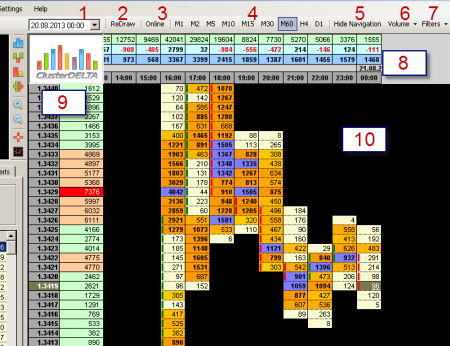
1. The date / time of which the chart will be displayed (or loaded additionally if necessary)
2. "Redraw" – the button for the chart redrawing according to p.1. Pay attention that the date and time should be specified correctly. If the date is not within the already loaded data, the platform will download the data again (for the length of history set in the upper menu Settings-> History Length)
3. "Online" - the button for the workspace fast navigation to the last cluster.
4. Selects the time interval (timeframe) for the chart in the workspace.
5. Hides the left panel increasing the workspace
6. Switches modes Volume / Delta / Volume x Delta / Purchase x Sales
7. Applies filters to display data.
8. The summary information on the data from up to down: volume per cluster, delta per cluster (trades on Ask minus trades on Bid), cumulative delta (starts from the first bar).
9. The price is on the left and the total volume at each price for the period indicated in the Prices tab, p.16 (screen below) is on the right. The highlighted price shows the last price of ClusterDelta or in other words the current price.
10. The cluster chart (another way to display a candlestick chart, where there is an information on the number of volume closed trade contracts arranged by time per each price)
Tabs:
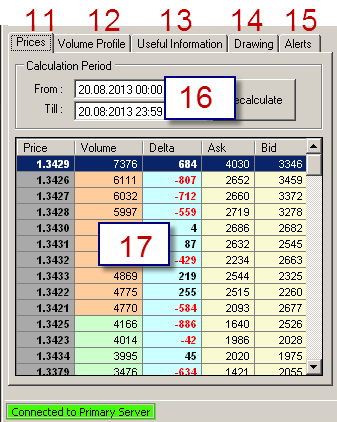
11. "Prices" – the summary information on volumes, deltas, purchase and sales at prices for the time period specified in p.16
12. The volume profile for the period of time specified in p. 18 (see below)
13. Rating levels (Contract / Last Week / Current Week) for 4 levels for each interval. The required intervals are selected - p.19 (screen below) and drawn with the specified colors (selected in p.22) by clicking on the "Draw on Chart" button.
14. The ability to apply indicators, change levels color and prevent history loading when trying to enter an unloaded invisible area to the left of the chart in Drag & Drop mode.
15. Notification system.
16. The period of data calculation in this tab as well as the calculation of volumes (near the price, p. 9) in the workspace
17. Data arranged on price and time with the possibility of their sorting relatively to each other.
Tab display
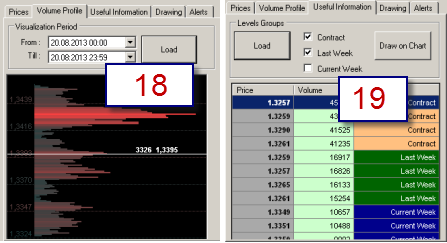
18. Period of the volume profile display.
19. Selection and loading result (after clicking the button "Load") of rating contracts.
Drawing tab:
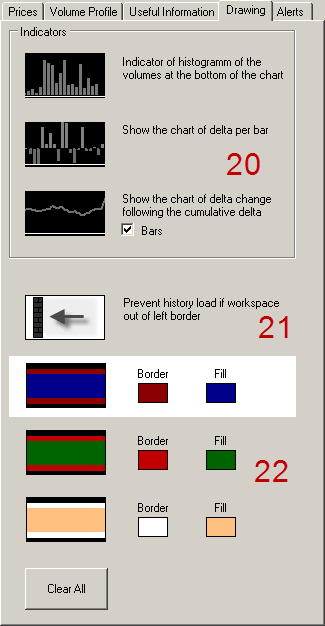
20. Selection of one of the three indicators for display in the workspace (volume / delta / cum.delta)
21. The icon prevents history loading when dragged out of the cluster chart left border.
22. Three preset level parameters (with the ability to change) and one selected by default, which is applied by right-clicking on the price. In addition, the "Clear All" button to remove all applied levels.

