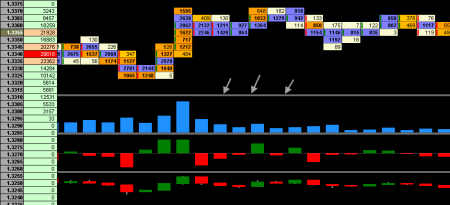
Within the ClusterDelta latest version three standard indicators are added for convenient visual perception:
- volume histogram
- delta histogram
- cummulative delta histogram with an additional setting (Bar) which sets chart mode in the form of a bar or a line

Common indicators information:
- If the range of values is overflowed and the current chart should go beyond the current area this area will be marked with a color OverFlow Flag Color and in a while the platform will redraw the indicators.
- All indicators use the maximum and minimum values basing on downloaded and memory-mapped data.
List of indicators:
- Volume indicator - a histogram with the total volume value in the cluster
- Delta indicator – a histogram with the total delta value in the cluster
- Cumulative delta indicator is a curve line or chart of the cumulative delta change in time. The zero bar should be considered the first bar of the chart.
The type of the chart is selected basing on the Bars parameter
In addition pay attention to the gray arrows in the picture: by clicking and dragging this double line (any double line) you can change the size of this indicator.


