Thanks to modern technology, research data has become more accessible to ordinary traders. Until that time, the strategic volume analysis strategies were Market Profile and VSA. Market Profile is an attempt to track market activity in 30-minute candles. VSA — analysis of smart money actions using a volume histogram within a time terminal.
Cluster analysis is the most accurate and most detailed type of analysis, since the basis for the analysis is a transaction that takes place on the exchange. Combining the results using mathematical operations according to the established criteria (time interval, volumes) at the output will be presented in the distribution of volumes for each price - this is a cluster. The price chart is presented in the form of clusters, called a cluster chart.
Unlike forex, all data on an exchange-traded instrument comes from only one source, therefore, this data (price/volume) cannot be estimated independently of of how and where they were obtained, provided of course that they were obtained from the exchange and were not filtered.
However, the existing range of functionality of exchange terminals, the limited range of data functionality and other technical and financial conditions make it practically impossible for the trading occupation to analyze clusters based on data over long periods. In this regard, an installation arose that decided to set these tasks. Thus, the first future developments of the ClusterDelta platform appeared, which, over time, from scripts written in VBA in Excel, moved into the modern phase and became a full-featured system that provides real-time cluster data. More detailed information about the functionality of the platform is found in the "Functionality" tab.
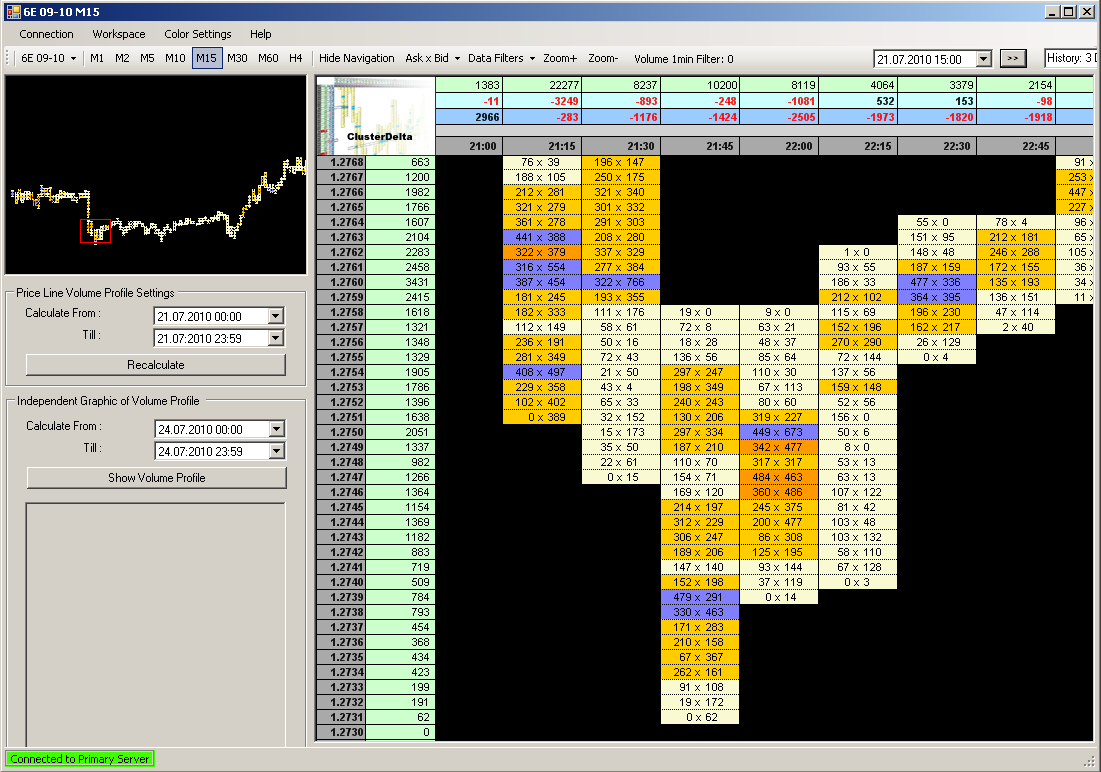
Cluster Graph View:
To run, you must have the .Net Framework package installed at least version 2.0, platform independent - no other software is required for the platform to work.
At launch, the platform requests a list of instruments that are updated online.
In most cases, you will get a picture with a list of tools as shown below.
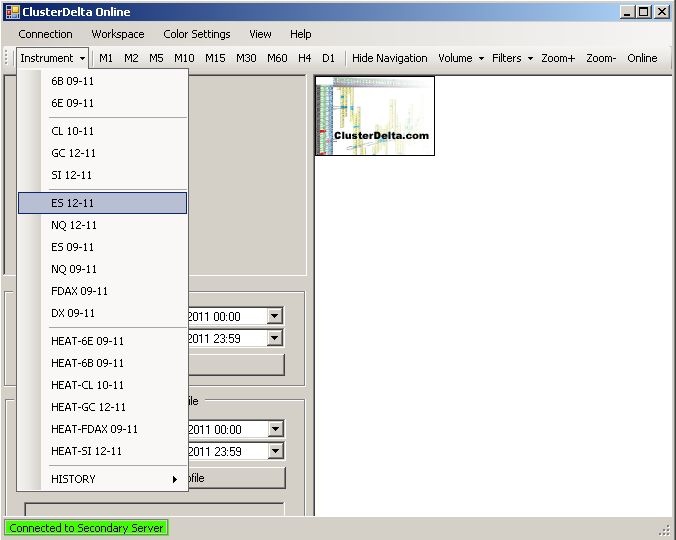
If, for some reason (usually lack of Internet), the list of tools cannot be obtained, you will be offered the "CONNECT" button instead of the tools, which will re-request this list, and in the status line it will give an error: "Error : unable to connect to server"
When you select an instrument, the platform will request history from the server starting from the specified date for the entire history.
Also pay attention to your time zone and the time zone specified in the platform. If necessary, change.
If everything is set correctly - after selecting an instrument in the navigation window, you will see the history of the instrument in the form of a graph. Taking the red square with the mouse, you need to move it to the place that will be displayed in the active area. The chart itself can be moved by Drag&Drop.
Platform features:
- Cluster chart (view: volume, delta, volume x delta, ask x bid)
- Volume filters (visual filters, volume size filters)
- Volume profile for the required period
- Changing the interface color scheme
and also:
- two alternative communication channels to data servers
- adjust to time zone
- almost complete ONLINE update (1 time per 3 seconds)
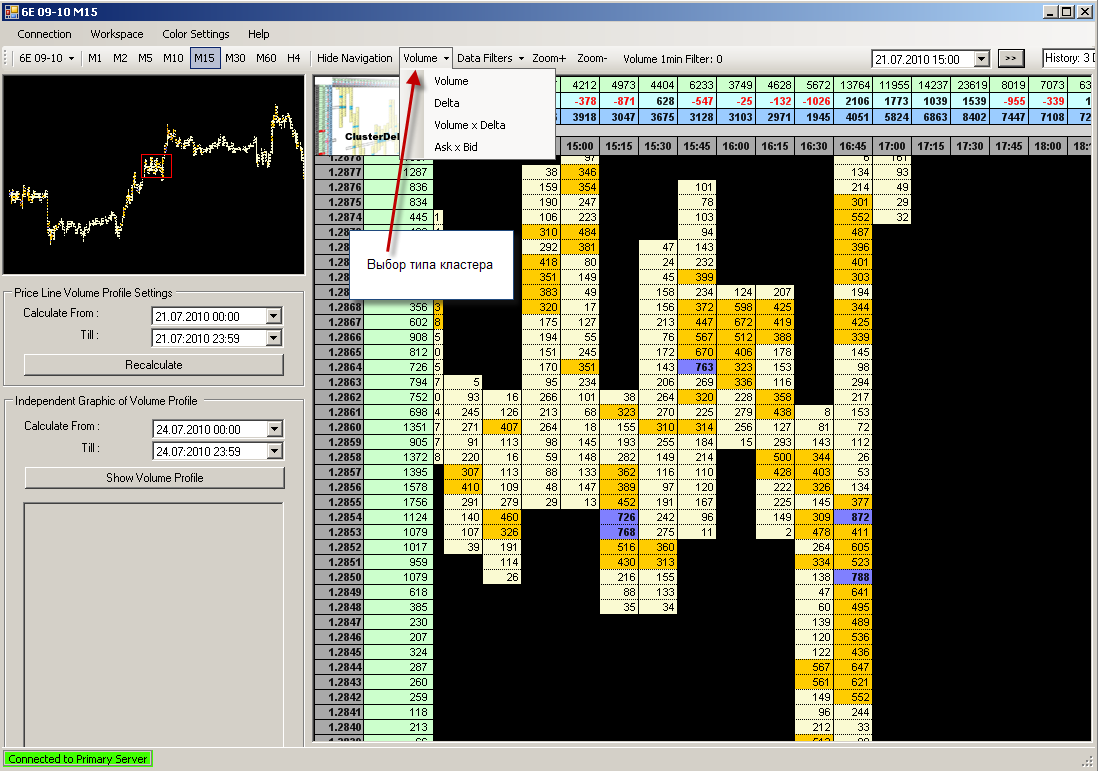
A cluster chart can be represented as volumes, as deltas, as volumes and deltas by price, as the number of Ask and Bid orders
To simplify visual perception, the maximum volumes are highlighted in different colors - for the small volume filter, you can set the lower (minor) and upper (major) limits of the filters. Anything below the bottom of the filter is not highlighted. The volume from the lower to the upper boundary has a separate color setting (Cluster Filter Minor Bg), volumes above the upper boundary also have their own color setting (Cluster Filter Major Bg). The maximum volume above the upper limit is highlighted separately (Cluster Max Volume Bg).
The volume profile on the left side is built separately (from the data in the main part of the screen) for the specified period of time.
In case of force majeure situations on the server side, the program will automatically switch to another server via an alternative communication channel
Every day, opening the terminal, we see a graph of price changes for a certain time period. Note that the chart along the X axis can be built not only by the time period, but also by a number of other criteria (volume size, number of ticks, bar size, and many others). But in addition to them - for volume trading, the main method of analysis is cluster analysis.
The minimum unit of measurement is a tick. The tick determines the current infusion of money into the market and, together with market data, provides the most valuable information:
- tick time
- volume
- price
- order type (buy/sell)
If we collect all the prices by ticks within a certain period, we will get a standard candle - which we see on the screen. In other words, a standard candle gives information about the price change over a certain period of time, but does not give any information about the infusion of volume at the price. If we add up all the volumes by ticks over the same period of time, we will get the volume of the candle. Candlestick volume is already useful information and is used to build a horizontal histogram of volumes.
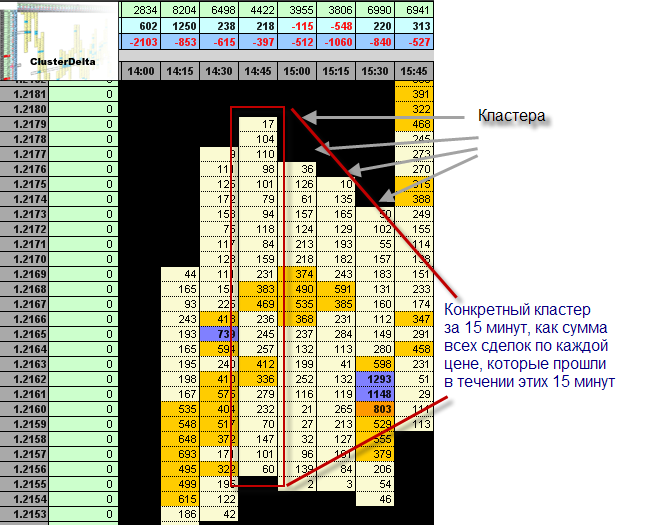
The core of cluster analysis is the cluster.
A cluster is a bar over a certain period of time where the tick volumes for each price are summed up, in which case we essentially see the following:
- price change over a certain period
- volume injections at each price in this period
- total volume of the cluster
The second important point is the delta. Unfortunately, due to the impossibility for an ordinary trader to obtain a delta using improvised methods, there is practically no information on its use on the Internet, and the one that is contains very rough assumptions.
Delta
As we know, a deal can be of two types: buying or selling.
Buy is a trade executed at the purchase price (Ask), sale is a trade at the sell price (Bid).
The spread is the difference between the current market buy price and the market sell price. What we see as the current price is actually the price of the last executed transaction (Last price), i.e. past, not present. At this time, the market price (ask/bid) may move away from Last by some distance, but, with current trading volumes on liquid instruments, as a rule, this is no more than 1-5 pp.
Since only deals made at Ask and Bid prices are available on the market, clusters can be represented as follows:
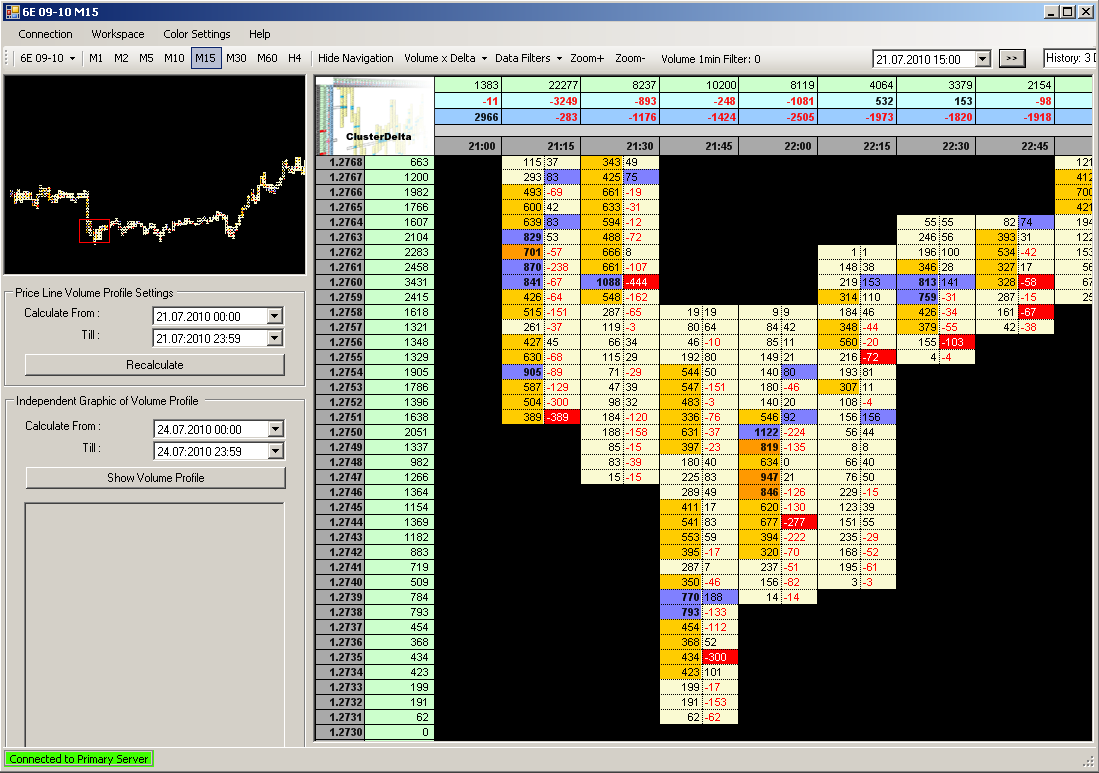
- Volume - the amount of purchases and sales (by time, by price, etc.). Volume = buy+sell
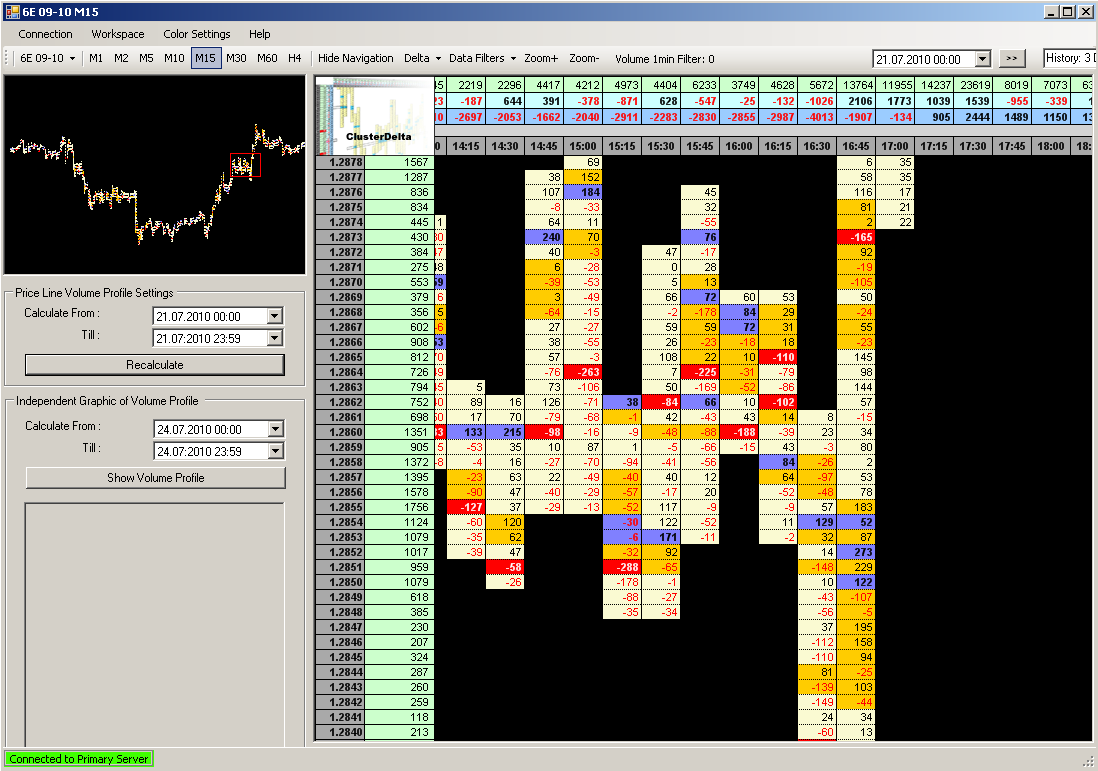
- Delta - difference between buys and sells according to the same criteria. Delta=buy-sell
and a combination of different shapes:
- Volume x Delta - volume and delta
- Ask x Bid - volume of orders executed separately at Ask and Bid prices
Clusters by volume (Volume):
Cluster by delta (Delta):
Volume x Delta Cluster:
Ask x Bid Cluster:
