
")
The navigation panel consists of a pop-up instruments list, quick access icons and also we would like you to pay your attention to Chart Type menu.
The main task of the navigation panel is to provide a mini copy of the area loaded into memory with the ability to navigate quickly through it. One can achieve this by clicking the left mouse button on the red rectangle and dragging it to the necessary point of the chart.
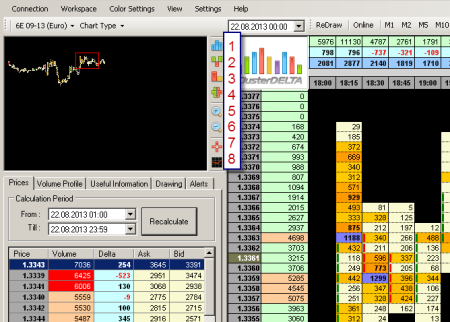
Vertical menu icons right next to the navigation panel has the following functions:
- Chart type: volume clusters
- Chart type: delta clusters
- Chart type: clusters of volume x delta
- Chart type: clusters of ask x bid
- Zoom in/oute
- Cursor shape: normal or crosshair (also changeable by clicking the mouse wheel)
- Adding / Removing Indicators
Moreover we would like to draw your attention to pop-up list "Chart Type". The option "Show Open / Close" implies the need to highlight the bar direction. By default, a bullish bar is highlighted as small green rectangles to the left of the cluster value. The lower level is the Open price, the higher one is the Close price. The bearish bar is red and consequently the highest point is the Open price the lowest one is the Close price.
In addition for the convenient visual perception the term Heat was introduced: this is the m of the chart along the vertical axis, so that when you view it visually, it would fit as efficiently as possible into the working area of the monitor. The volumes under minimization are summarized. For the EURO chart the vertical axis interval is 0.0005 (unlike the usual 0.0001) and it appears as follows.
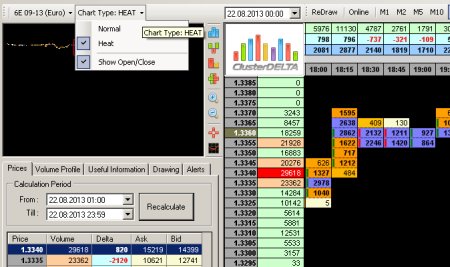
Heat Charts are convenient to use either on a large scale or on an over-volatile graphics.

