
")
Indicator Name: ClusterDelta_#Imbalance
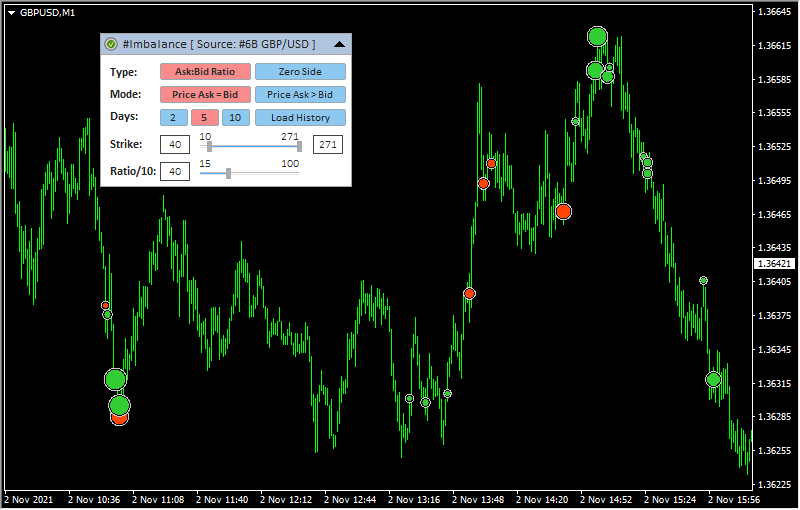
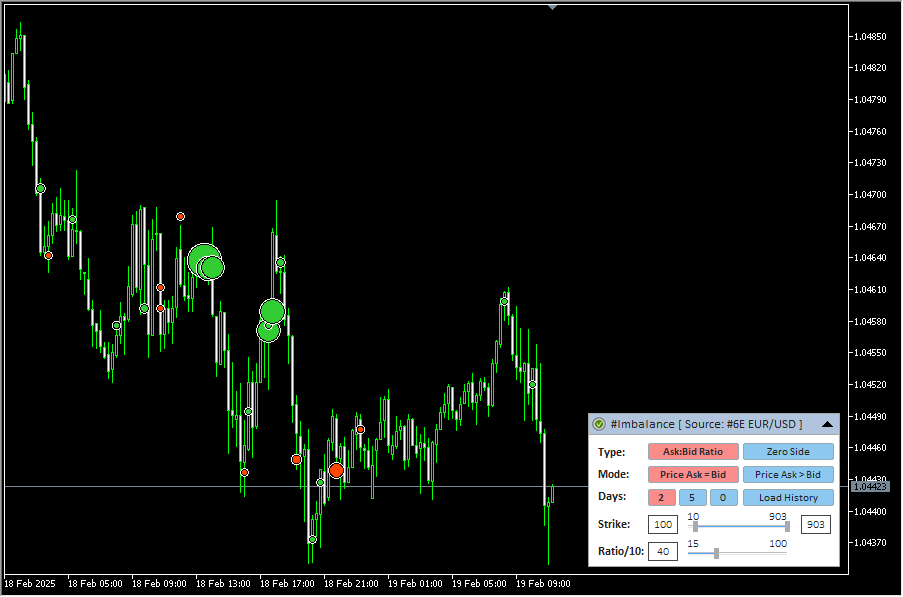
The #Imbalance indicator is designed to display trade imbalances in the trading process. The most common form of imbalance is a significant ratio between buyers and sellers (more than 3:1, 4:1 in any direction) or the complete absence of one of them.
The #Imbalance indicator is designed to display the most common types of imbalance, such as the ratio of buyers and sellers within the same price, and market imbalance type, when the Ask price is always higher than the Bid price.
The imbalance is clearly visible on the cluster chart, but this indicator was created for easy viewing them on the price chart.
Pay attention to the image below, here is a cluster chart in the Ask x Bid mode (on the left there are orders executed at the Ask price and above, on the right - at the Bid price and below)
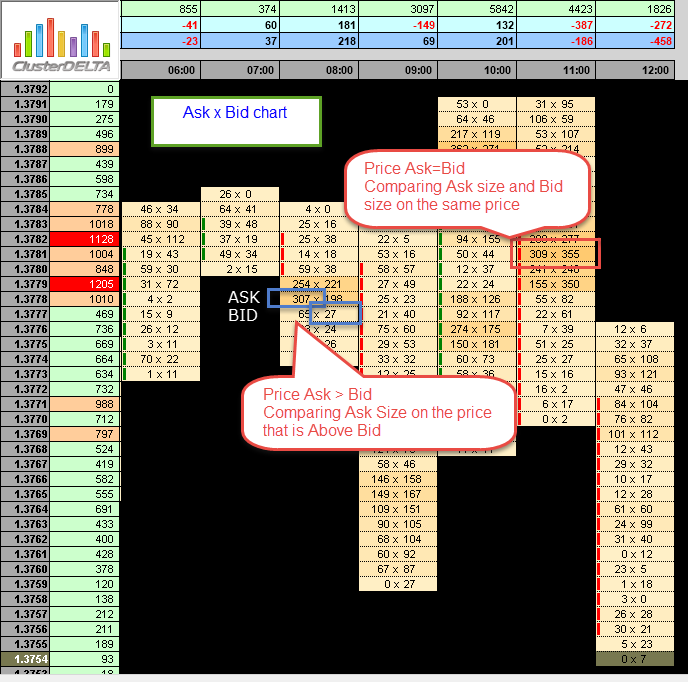
In the left part in blue rectangles, positions 307 and 27 are marked as imbalance (307: 27 > 11) in the mode when the Ask price is higher than the Bid price. On the right side in the red square, the position 309x355 (is really not an imbalance, but just an example) to understand how shows an imbalance with mode when Ask price = Bid price
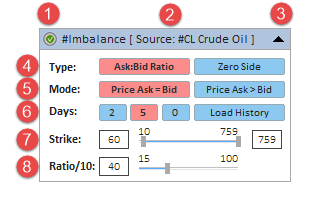
Description of graphic panel:
-
1 - authorization status (for more details on authorization, see the How to install and use indicators section)
- Ask:Bid Ratio - the indicator will analyze the ratio between buyers (Ask orders) and sellers (Bid orders) assuming that the ask and bid order must be greater than zero.
- Zero Side - the indicator will looks for the imbalances only where the ask or bid size is absent (=0) and it is not located on the high or low price of the candle
- Price Ask = Bid - the indicator will look for the imbalance when the Ask and Bid price is the same
- Price Ask > Bid - the indicator will look for the imbalance when the Ask price is above Bid price
2 - the name of the indicator and the instrument - the data source. Using Drag & Drop, you can move the panel along the chart (to activate the panel, you may need to double-click the mouse)
3 - the icon to Expand/Collapse graphic panel
4 (Type) - indicator building mode corresponding to the Type_Data input parameter. .
5 (Mode) - indicator building mode corresponding to the Calculate_Mode input parameter.
6 (Days) - the number of days to build the indicator corresponding to the History_In_Days input parameter. The value defines the number of days to display the indicator data. The "0" values removes all Imbalance objects. The "Load History" button loads the amount of history (in days). For the correct displaying of Imbalance objects due to technical obstacles clicking "Load history" button removes all objects before loading new period (current day will be reloaded later).
7 (Strike) - the range of volume values that is used to plot on the chart. The minimum value is defined by the The Lowest Strike Value parameter; to optimize the load, the minimum value of Ask or Bid size is set at 10 lots but the allowed minimum is 1. The maximum is defined on the actual data. In the graphical panel, the current values can be changed with the slider or by editing the value in the text fields.
8 (Ratio/10) - the Ratio size corresponding to the RatioK input parameter. The value of this parameter means a ratio to a value of 10 (i.e., a value of 40 means 40:10 or 4: 1). To change the Ratio parameter, you need to move the slider or change its value in the text field. After changing the value of this parameter, an additional button will appear to the right of the slider with a new value and a "?" - as a proposal to change the parameter. To apply a new value, click on this button (when you hover the mouse over the button, the "?" Sign will change to "!").
You can hide the panel completely from the screen with the "Z" key and show it again by "X" key.
The F5 button allows you to reinitialize the coordinates of the panel based on the current size of the chart window (it helps if the panel has disappeared from the workspace). Please note that resetting coordinates will not display the panel that is already hidden by the Z button or by the input "GUI" parameter.
When adding an indicator to a chart, priority is given to the input parameters. However, after making changes to the settings through the graphic panel, the indicator takes the current parameters from the graphic panel when the timeframe changes. In some cases, removing and re-attaching an indicator will help to solve a specific problem.
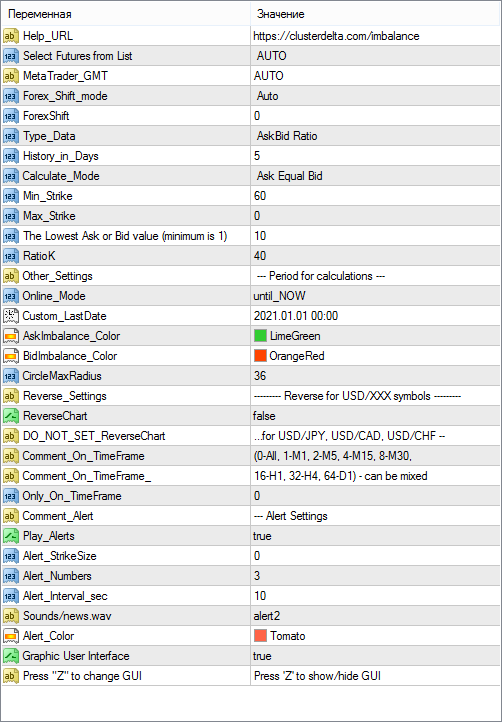
Description of indicator inputs:
- HELP_URL - this is the URL where you can get the full description of the indicator.
- Select Futures from List - select a futures from the dropdown list as the source for data. Value Auto Select causes automatic detection of the instrument by the MT ticker.
- MetaTrader_GMT - the GMT value of your Metatrader. In 95% of cases leave AUTO.
- Forex_Shift_mode - defines a method for calculating the difference in the prices between futures and forex.
Possible values of the Forex_Shift_mode:
- Auto - the offset will be calculated based on the "High" and "Low" prices of the forex and futures bar.
- Manual - the offset will be set manually via the Forex_Shift variable
- Forex_Shift - the number of points by which the indicator data will move up or down if the Forex_Shift_mode parameter is set to "Manual". This variable can be either greater than or less than zero. It is intended to take into account the forward points (the difference between the prices of the futures and the forex/spot).
- Type_Data - selection of a source for calculating and plotting the data
The possible values of Type_Data:
- Ask:Bid Ratio - the indicator will analyze the ratio between buyers (Ask orders) and sellers (Bid orders) assuming that the ask and bid order must be greater than zero.
- Zero Side - the indicator will looks for the imbalances only where the ask or bid size is absent (=0) and it is not located on the high or low price of the candle
- History_in_Days - the number of days to plotting data.
- Calculate_Mode - selection of a method for calculating the data
The possible values of Calculate_Mode:
- Ask Equal Bid - the indicator will look for the imbalance when the Ask and Bid price is the same
- Ask Above Bid - the indicator will look for the imbalance when the Ask price is above Bid price
- Min_Strike - the minimum value of the largest volume in the Ask:Bid pair.
- Max_Strike- the maximum value of the largest volume in the Ask:Bid pair. If the value is "0", the maximum value will be found from the loaded data.
- LowLevelStrike - the minimum value of the volume size to download from the server to optimize the load when working with the graphical panel. The minimum value is 0. If Min_Strike is 0 and LowLevelStrike is 0, the mode "Zero Side" automatically will be activated to "Ask:Bid Ratio" mode.
- Online_Mode (default value is "until_NOW") - defines how to load data
- until_NOW - load data until the current moment
- until_CustomLastDate - load data until time defined in Custom_LastDate
- Custom_LastDate - defines the end date/time to load data if the Online_Mode parameter is set to "until_CustomLastDate"
- AskImbalance_Color - the color for displaying imbalances objects where the Ask volume is greater than Bid Volume
- BidImbalance_Color - the color for displaying imbalances objects where the Bid volume is greater than Ask Volume
- CircleMaxRadius - maximum circle radius that us used to scale different imbalance values.
- ReverseChart - for reverse currency pairs with names that differ from "USD/JPY", "USD/CAD", "USD/CHF", the value must be "true" to flip indicator data according to the direction of the price chart
- DO_NOT_SET_ReverseChart (for"...for USD/JPY, USD/CAD, USD/CHF --") - the comment in the inputs about the information describe above
- Play_Alerts - use "true" if you want the indicator plays sound notifications when the new imbalances appear.
- Push_Alerts - use "true" if you want the indicator send push notification to your mobile (that is connected by MetaQuotes ID in the MT options) when the new imbalance object appears.
- Alert_StrikeSize - the size of the value after that the sound alert will be played. If the value is "0", it determines automatically based on the current parameters.
- Alert_Numbers - the number of times to play the alert if it triggered.
- Alert_Interval_sec - interval (in seconds) between alert plays
- Alert_Filename - the name of the file to play (the .wav files are located in the МТ4 \ Sounds folder, you do not need to specify the .wav extension) if alert is triggered
- Alert_Color - text color of alert message
- GUI - flag indicating the need to draw a graphical user interface (control panel)
- GUI_Hint - usage of hot keys. Press 'Z' to hide / 'X' to show GUI

