Indicator Name: ClusterDelta_#Volumes_Colored
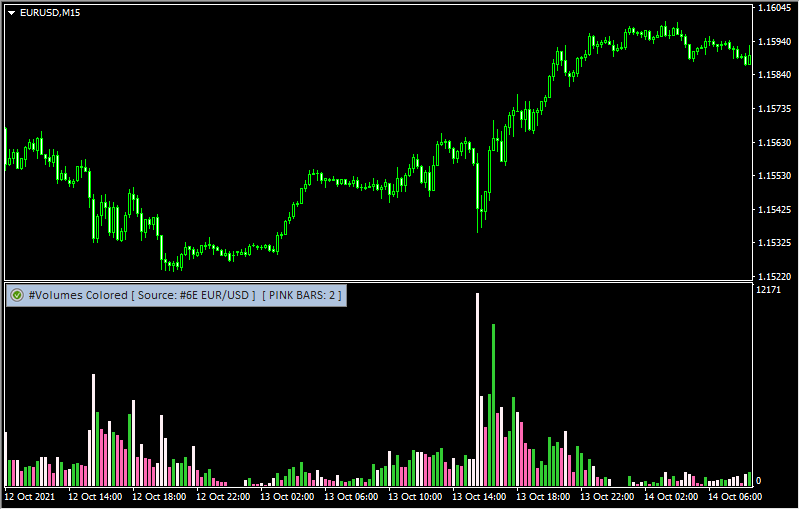
This volume indicator provides information on the total traded volumes for each bar using specific color set that is know as "Pink Volumes".
Big volumes spike in market activity supposes the end of the current trend. An additional price rally (breakout of the previous peak) on smaller volumes can be a sign of a reversal, which visually can look like a divergence of price peaks and peaks of the volume histogram. This describes one of the options for how to use the indicator, but this is not the only description of using the volume indicator. Use it with VSA patterns as well.
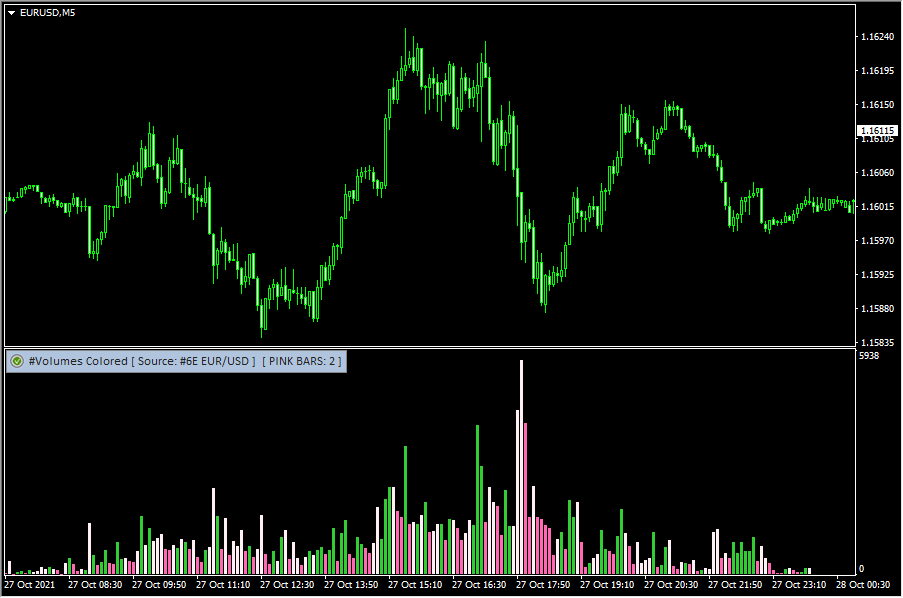
This modification made an upon request of the traders group to implement "Pink Volumes" feature. If the Pink_Bar value is greater than zero, the indicator checks the following criteria: the size of the current volume should not be higher than the previous Pink_Bar bars. If the condition is met, the current volume bar is considered as the Pink bar, otherwise the bar is colored in a color depending on the type of price candle (bearish / bullish)
If you set the Pink_Bar value equal to zero, then all bars will be colored only by the type of price candle (bearish / bullish)
In the settings it is possible to adjust the length of the history in days, which allows you to make backtests on historical data merged together for more than 2 years. It is also possible to load history with one click (by the "Load More History" button), which is located in the place where the loading of the previous period of historical data ended.

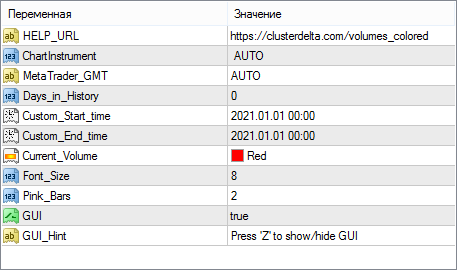
Description of indicator inputs:
- HELP_URL - this is the URL where you can get the full description of the indicator.
- Select Futures from List - select a futures from the dropdown list as the source for data. Value AUTO causes automatic detection of the instrument by the MT ticker.
- MetaTrader_GMT - the GMT value of your Metatrader. In 95% of cases leave AUTO.
- Days_in_History - this parameter defines the number of days to download history. For a "0" value , the server uses the optimized history length settings. Using too high values can cause to the terminal freezing on lower timeframes. It is recommended to use short periods and load more data from the chart using the button "Load More History"
- Custom_Start_time, Custom_End_time - if Custom_Start_Time and Custom_End_Time differ from the default value, the server loads the history for the period specified by these parameters.
- Current_Volume - the color of the text of current volume on the last (current) bar.
- Font_Size - font size of the current value
- Pink_Bars - the value to calculate Pink bar (as a volume that is not higher than other volumes for the last amount of the bars defined by the "pink_bars" value).
- GUI - flag indicating the need to draw a graphical user interface (control panel)
- GUI_Hint - usage of hot keys. Press 'Z' to hide / 'X' to show GUI
You can change the colors of the histograms on the Colors tab in the indicator properties.


